Help & Documentation
  • Home
  • Sign In
  • Contact Us
  • Home
  • Sign In
  • Contact Us

US T-Bond down to 153.0938

/Futures Technical Analysis - TD/US T-Bond down to 153.0938

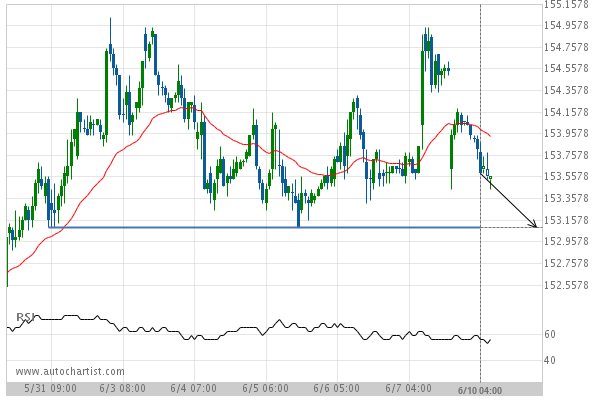
US T-Bond down to 153.0938

Posted on June 10, 2019 by Autochartist wrote in Futures Technical Analysis - TD.

Approaching Support level of 153.0938 identified at 10-Jun-2019 04:00 EDT

Tags: ZB
0 Likes
651 Views

You may also like

Soybeans up to 1162.2500
November 17, 2020
Light Sweet Crude Oil Front Month down to 37.2132
September 30, 2020
Light Sweet Crude Oil Front Month up to 40.9420
October 23, 2020

Comments are closed.

10 year T-Note down to 126.0087 Gold Front Month down to 1315.9450

Futures Technical Analysis – TD

Light Sweet Crude Oil Front Month up to 67.9800

March 9, 2021 11:17 am | By Autochartist

Rising Wedge identified at 09-Mar-2021 05:00 EST. This pattern is... Read more →

Feeder Cattle Front Month down to 137.2250

March 9, 2021 11:17 am | By Autochartist

Channel Down identified at 08-Mar-2021 14:00 EST. This pattern is... Read more →

Soybean Oil up to 53.2300

March 9, 2021 11:17 am | By Autochartist

Channel Up identified at 09-Mar-2021 04:30 EST. This pattern is... Read more →

Silver Front Month up to 26.5600

March 9, 2021 11:17 am | By Autochartist

Approaching Resistance level of 26.5600 identified at 09-Mar-2021 04:00 EST Read more →

10 year T-Note up to 133.1644

March 9, 2021 11:17 am | By Autochartist

Falling Wedge has broken through the resistance line at 09-Mar-2021... Read more →

  • About Us
  • Privacy Policy
  • Disclaimer
  • Terms and Conditions
  • Get started for FREE
  • Contact Us
Copyright © 2020 Autochartist.com. All rights reserved.
This site uses cookies: Find out more.