Help & Documentation
  • Home
  • Sign In
  • Contact Us
  • Home
  • Sign In
  • Contact Us

Visa (V) excessive bearish movement

/US Stocks Statistical Analysis - TD/Visa (V) excessive bearish movement

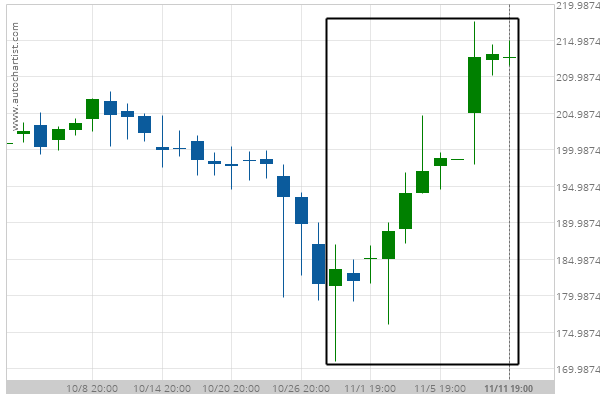
Visa (V) excessive bearish movement

Posted on November 12, 2020 by Autochartist wrote in US Stocks Statistical Analysis - TD.

Visa experienced a 15.88% bullish movement in the last 14 days.

Tags: V, Visa
0 Likes
418 Views

You may also like

Caterpillar Inc. (CAT) excessive bearish movement
December 12, 2018
Home Depot Inc. (HD) excessive bearish movement
November 25, 2019
Exxon Mobil Corp. (XOM) excessive bearish movement
October 30, 2018

Comments are closed.

Lean Hogs down to 60.9462 Mcdonalds Corp. (MCD) excessive bearish movement

US Stocks Statistical Analysis – TD

Walt Disney (DIS) excessive bullish movement

March 9, 2021 11:16 am | By Autochartist

Walt Disney experienced 4 consecutive bullish candles. Possible bearish price... Read more →

Chevron (CVX) excessive bearish movement

March 9, 2021 11:16 am | By Autochartist

Chevron experienced a 27.28% bullish movement in the last 36... Read more →

Boeing Co. (BA) excessive bearish movement

March 8, 2021 11:19 am | By Autochartist

Boeing Co. experienced 3 consecutive bearish candles. Possible bullish price... Read more →

3m Co. (MMM) excessive bullish movement

March 8, 2021 11:19 am | By Autochartist

3m Co. experienced 5 consecutive bullish candles. Possible bearish price... Read more →

Verizon Communications Inc. (VZ) excessive bullish movement

March 8, 2021 11:19 am | By Autochartist

Verizon Communications Inc. experienced 4 consecutive bullish candles. Possible bearish... Read more →

  • About Us
  • Privacy Policy
  • Disclaimer
  • Terms and Conditions
  • Get started for FREE
  • Contact Us
Copyright © 2022 Autochartist.com. All rights reserved.
This site uses cookies: Find out more.