Help & Documentation
  • Home
  • Sign In
  • Contact Us
  • Home
  • Sign In
  • Contact Us

Lean Hogs down to 60.9462

/Futures Technical Analysis - TD/Lean Hogs down to 60.9462

Lean Hogs down to 60.9462

Posted on November 12, 2020 by Autochartist wrote in Futures Technical Analysis - TD.

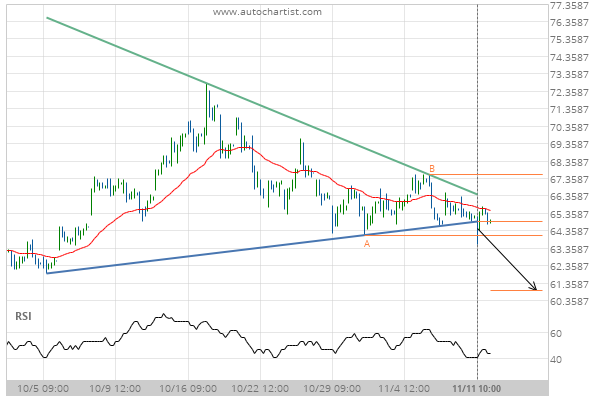
Triangle has broken through the support line at 11-Nov-2020 10:00 EST. Possible bearish price movement forecast for the next 2 days towards 60.9462.

Tags: CME, HE
0 Likes
294 Views

You may also like

Light Sweet Crude Oil Front Month up to 34.8100
May 28, 2020
Lean Hogs down to 61.2500
January 14, 2019
Soybean Oil up to 53.2300
March 9, 2021

Comments are closed.

US T-Bond down to 169.5000 Pfizer Inc. (PFE) excessive bearish movement

Futures Technical Analysis – TD

Light Sweet Crude Oil Front Month up to 67.9800

March 9, 2021 11:17 am | By Autochartist

Rising Wedge identified at 09-Mar-2021 05:00 EST. This pattern is... Read more →

Feeder Cattle Front Month down to 137.2250

March 9, 2021 11:17 am | By Autochartist

Channel Down identified at 08-Mar-2021 14:00 EST. This pattern is... Read more →

Soybean Oil up to 53.2300

March 9, 2021 11:17 am | By Autochartist

Channel Up identified at 09-Mar-2021 04:30 EST. This pattern is... Read more →

Silver Front Month up to 26.5600

March 9, 2021 11:17 am | By Autochartist

Approaching Resistance level of 26.5600 identified at 09-Mar-2021 04:00 EST Read more →

10 year T-Note up to 133.1644

March 9, 2021 11:17 am | By Autochartist

Falling Wedge has broken through the resistance line at 09-Mar-2021... Read more →

  • About Us
  • Privacy Policy
  • Disclaimer
  • Terms and Conditions
  • Get started for FREE
  • Contact Us
Copyright © 2020 Autochartist.com. All rights reserved.
This site uses cookies: Find out more.