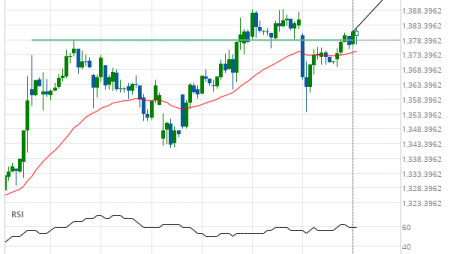
US T-Bond up to 142.6916

Falling Wedge has broken through the resistance line at 12-Sep-2018 10:00 UTC. Possible bullish price movement forecast for the next 20 hours towards 142.6916.
Falling Wedge has broken through the resistance line at 12-Sep-2018 10:00 UTC. Possible bullish price movement forecast for the next 20 hours towards 142.6916.