Help & Documentation
  • Home
  • Sign In
  • Contact Us
  • Home
  • Sign In
  • Contact Us

Lean Hogs down to 63.3750

/Futures Technical Analysis - TD/Lean Hogs down to 63.3750

Lean Hogs down to 63.3750

Posted on November 5, 2019 by Autochartist wrote in Futures Technical Analysis - TD.

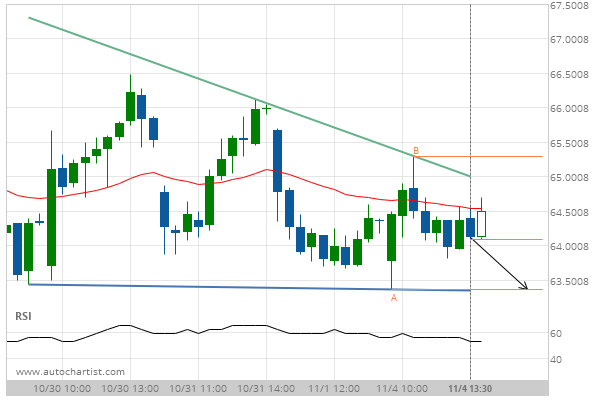
Descending Triangle identified at 04-Nov-2019 13:30 EST. This pattern is still in the process of forming. Possible bearish price movement towards the support 63.3750 within the next 6 hours.

Tags: CME, HE
0 Likes
706 Views

You may also like

Soybeans up to 872.0000
March 19, 2020
Gold Front Month up to 1328.6000
February 5, 2019
Corn up to 377.0000
Corn up to 377.0000
August 30, 2019

Comments are closed.

Feeder Cattle Front Month up to 146.8250 CORN DECEMBER 2019 excessive bearish movement

Futures Technical Analysis – TD

Light Sweet Crude Oil Front Month up to 67.9800

March 9, 2021 11:17 am | By Autochartist

Rising Wedge identified at 09-Mar-2021 05:00 EST. This pattern is... Read more →

Feeder Cattle Front Month down to 137.2250

March 9, 2021 11:17 am | By Autochartist

Channel Down identified at 08-Mar-2021 14:00 EST. This pattern is... Read more →

Soybean Oil up to 53.2300

March 9, 2021 11:17 am | By Autochartist

Channel Up identified at 09-Mar-2021 04:30 EST. This pattern is... Read more →

Silver Front Month up to 26.5600

March 9, 2021 11:17 am | By Autochartist

Approaching Resistance level of 26.5600 identified at 09-Mar-2021 04:00 EST Read more →

10 year T-Note up to 133.1644

March 9, 2021 11:17 am | By Autochartist

Falling Wedge has broken through the resistance line at 09-Mar-2021... Read more →

  • About Us
  • Privacy Policy
  • Disclaimer
  • Terms and Conditions
  • Get started for FREE
  • Contact Us
Copyright © 2022 Autochartist.com. All rights reserved.
This site uses cookies: Find out more.