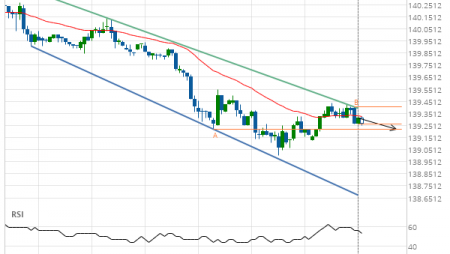
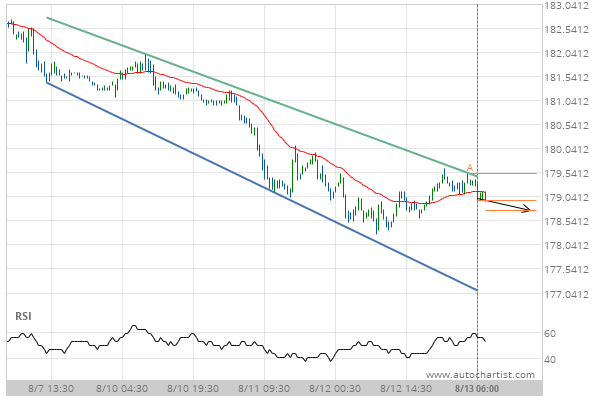
US T-Bond down to 179.1250
Channel Down identified at 13-Aug-2020 06:00 EDT. This pattern is still in the process of forming. Possible bearish price movement towards the support 179.1250 within the next day.
Channel Down identified at 13-Aug-2020 06:00 EDT. This pattern is still in the process of forming. Possible bearish price movement towards the support 179.1250 within the next day.