Help & Documentation
  • Home
  • Sign In
  • Contact Us
  • Home
  • Sign In
  • Contact Us

Gold Front Month up to 1964.9000

/Futures Technical Analysis - TD/Gold Front Month up to 1964.9000

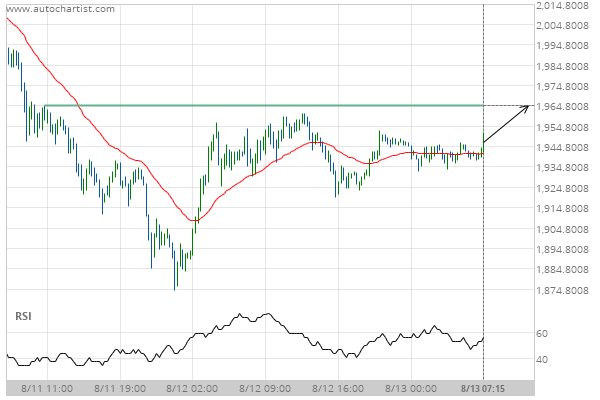
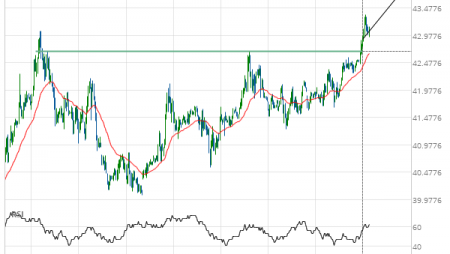
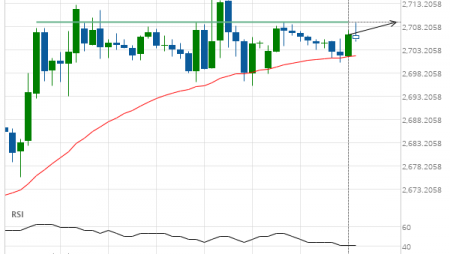
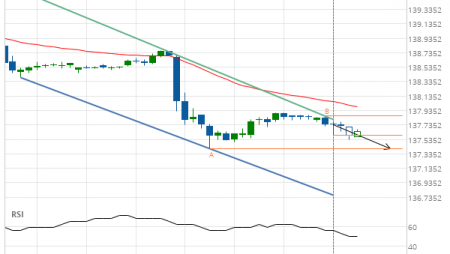
Gold Front Month up to 1964.9000

Posted on August 13, 2020 by Autochartist wrote in Futures Technical Analysis - TD.

Approaching Resistance level of 1964.9000 identified at 13-Aug-2020 07:15 EDT

Tags: GC
0 Likes
345 Views

You may also like

Soybeans up to 861.2500
May 15, 2020
Silver Front Month down to 23.0015
December 7, 2020
Corn down to 400.7500
November 13, 2020

Comments are closed.

10 year T-Note down to 139.2188 US T-Bond down to 179.1250

Futures Technical Analysis – TD

Light Sweet Crude Oil Front Month up to 67.9800

March 9, 2021 11:17 am | By Autochartist

Rising Wedge identified at 09-Mar-2021 05:00 EST. This pattern is... Read more →

Feeder Cattle Front Month down to 137.2250

March 9, 2021 11:17 am | By Autochartist

Channel Down identified at 08-Mar-2021 14:00 EST. This pattern is... Read more →

Soybean Oil up to 53.2300

March 9, 2021 11:17 am | By Autochartist

Channel Up identified at 09-Mar-2021 04:30 EST. This pattern is... Read more →

Silver Front Month up to 26.5600

March 9, 2021 11:17 am | By Autochartist

Approaching Resistance level of 26.5600 identified at 09-Mar-2021 04:00 EST Read more →

10 year T-Note up to 133.1644

March 9, 2021 11:17 am | By Autochartist

Falling Wedge has broken through the resistance line at 09-Mar-2021... Read more →

  • About Us
  • Privacy Policy
  • Disclaimer
  • Terms and Conditions
  • Get started for FREE
  • Contact Us
Copyright © 2020 Autochartist.com. All rights reserved.
This site uses cookies: Find out more.