Help & Documentation
  • Home
  • Sign In
  • Contact Us
  • Home
  • Sign In
  • Contact Us

US T-Bond down to 177.5000

/Futures Technical Analysis - TD/US T-Bond down to 177.5000

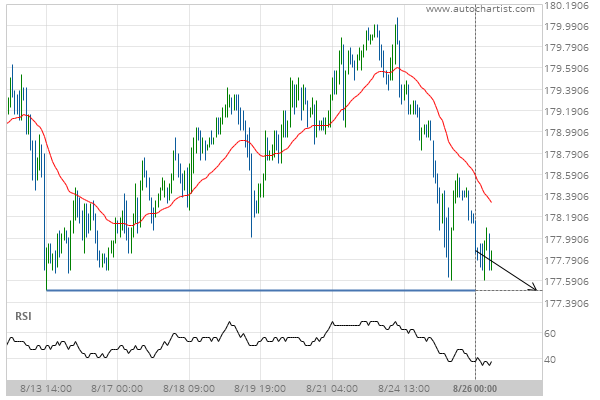
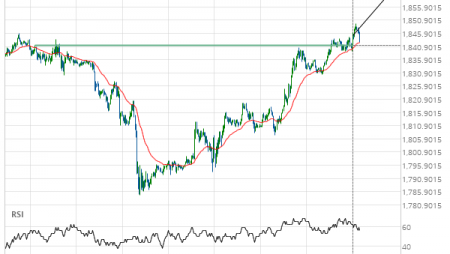
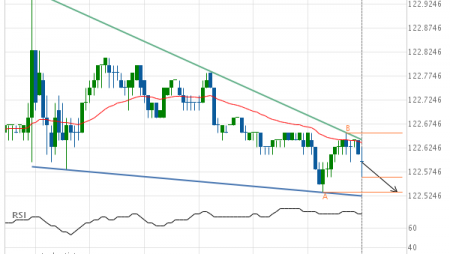
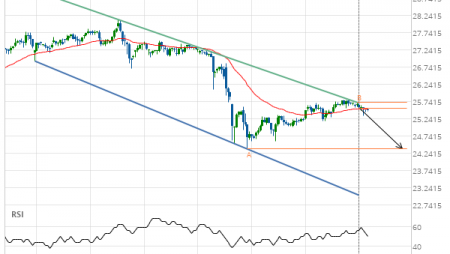
US T-Bond down to 177.5000

Posted on August 26, 2020 by Autochartist wrote in Futures Technical Analysis - TD.

Approaching Support level of 177.5000 identified at 26-Aug-2020 00:00 EDT

Tags: ZB
0 Likes
434 Views

You may also like

US T-Bond down to 154.4688
July 8, 2019
Lean Hogs up to 71.4325
January 1, 2021
Gold Front Month up to 1301.3000
March 12, 2019

Comments are closed.

Corn excessive bearish movement Silver Front Month up to 26.9000

Futures Technical Analysis – TD

Light Sweet Crude Oil Front Month up to 67.9800

March 9, 2021 11:17 am | By Autochartist

Rising Wedge identified at 09-Mar-2021 05:00 EST. This pattern is... Read more →

Feeder Cattle Front Month down to 137.2250

March 9, 2021 11:17 am | By Autochartist

Channel Down identified at 08-Mar-2021 14:00 EST. This pattern is... Read more →

Soybean Oil up to 53.2300

March 9, 2021 11:17 am | By Autochartist

Channel Up identified at 09-Mar-2021 04:30 EST. This pattern is... Read more →

Silver Front Month up to 26.5600

March 9, 2021 11:17 am | By Autochartist

Approaching Resistance level of 26.5600 identified at 09-Mar-2021 04:00 EST Read more →

10 year T-Note up to 133.1644

March 9, 2021 11:17 am | By Autochartist

Falling Wedge has broken through the resistance line at 09-Mar-2021... Read more →

  • About Us
  • Privacy Policy
  • Disclaimer
  • Terms and Conditions
  • Get started for FREE
  • Contact Us
Copyright © 2022 Autochartist.com. All rights reserved.
This site uses cookies: Find out more.