Help & Documentation
  • Home
  • Sign In
  • Contact Us
  • Home
  • Sign In
  • Contact Us

Gold Front Month up to 1862.0300

/Futures Technical Analysis - TD/Gold Front Month up to 1862.0300

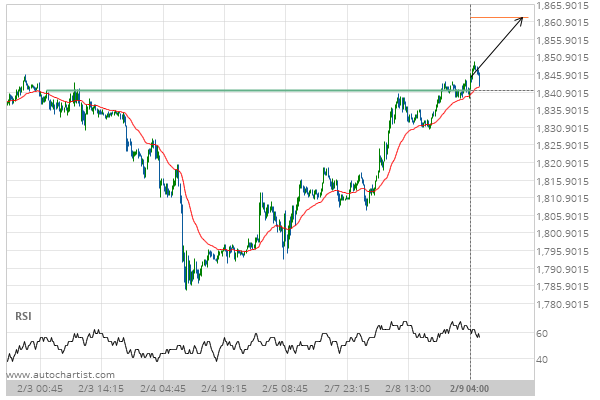
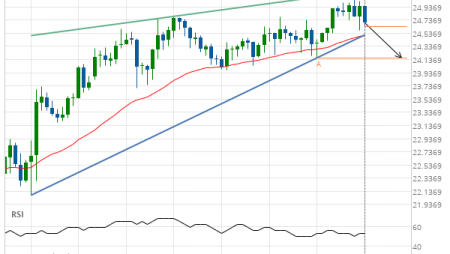
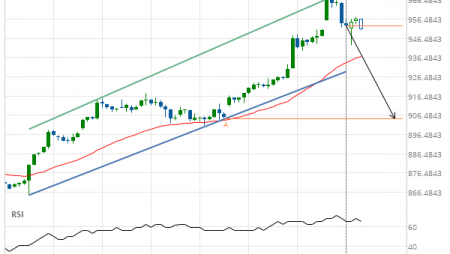
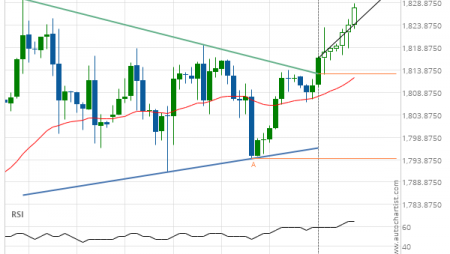
Gold Front Month up to 1862.0300

Posted on February 9, 2021 by Autochartist wrote in Futures Technical Analysis - TD.

Broke through Resistance level of 1841.4000 at 09-Feb-2021 04:00 EST

Tags: GC
0 Likes
337 Views

You may also like

10 year T-Note up to 127.2961
July 17, 2019
Light Sweet Crude Oil Front Month up to 55.7430
February 5, 2019
Silver Front Month down to 11.6400
March 19, 2020

Comments are closed.

Walt Disney (DIS) excessive bullish movement Silver Front Month up to 27.8800

Futures Technical Analysis – TD

Light Sweet Crude Oil Front Month up to 67.9800

March 9, 2021 11:17 am | By Autochartist

Rising Wedge identified at 09-Mar-2021 05:00 EST. This pattern is... Read more →

Feeder Cattle Front Month down to 137.2250

March 9, 2021 11:17 am | By Autochartist

Channel Down identified at 08-Mar-2021 14:00 EST. This pattern is... Read more →

Soybean Oil up to 53.2300

March 9, 2021 11:17 am | By Autochartist

Channel Up identified at 09-Mar-2021 04:30 EST. This pattern is... Read more →

Silver Front Month up to 26.5600

March 9, 2021 11:17 am | By Autochartist

Approaching Resistance level of 26.5600 identified at 09-Mar-2021 04:00 EST Read more →

10 year T-Note up to 133.1644

March 9, 2021 11:17 am | By Autochartist

Falling Wedge has broken through the resistance line at 09-Mar-2021... Read more →

  • About Us
  • Privacy Policy
  • Disclaimer
  • Terms and Conditions
  • Get started for FREE
  • Contact Us
Copyright © 2022 Autochartist.com. All rights reserved.
This site uses cookies: Find out more.