Help & Documentation
  • Home
  • Sign In
  • Contact Us
  • Home
  • Sign In
  • Contact Us

US T-Bond down to 162.0943

/Futures Technical Analysis - TD/US T-Bond down to 162.0943

US T-Bond down to 162.0943

Posted on February 4, 2020 by Autochartist wrote in Futures Technical Analysis - TD.

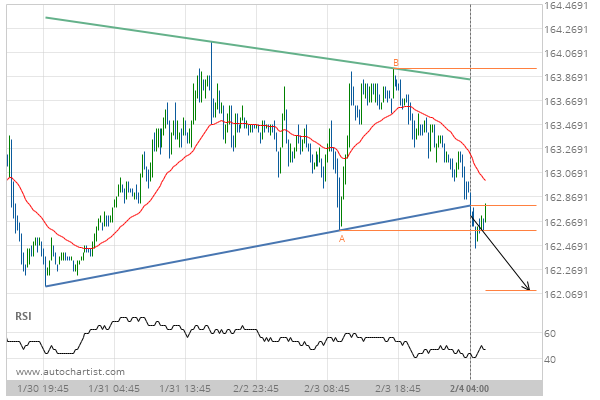
Triangle has broken through the support line at 04-Feb-2020 04:00 EST. Possible bearish price movement forecast for the next 16 hours towards 162.0943.

Tags: CBOT, ZB
0 Likes
663 Views

You may also like

Lean Hogs up to 66.9500
May 15, 2020
Gold Front Month up to 1305.5691
January 28, 2019
Silver Front Month up to 25.5855
July 31, 2020

Comments are closed.

10 year T-Note down to 130.7937 Silver Front Month down to 17.2800

Futures Technical Analysis – TD

Light Sweet Crude Oil Front Month up to 67.9800

March 9, 2021 11:17 am | By Autochartist

Rising Wedge identified at 09-Mar-2021 05:00 EST. This pattern is... Read more →

Feeder Cattle Front Month down to 137.2250

March 9, 2021 11:17 am | By Autochartist

Channel Down identified at 08-Mar-2021 14:00 EST. This pattern is... Read more →

Soybean Oil up to 53.2300

March 9, 2021 11:17 am | By Autochartist

Channel Up identified at 09-Mar-2021 04:30 EST. This pattern is... Read more →

Silver Front Month up to 26.5600

March 9, 2021 11:17 am | By Autochartist

Approaching Resistance level of 26.5600 identified at 09-Mar-2021 04:00 EST Read more →

10 year T-Note up to 133.1644

March 9, 2021 11:17 am | By Autochartist

Falling Wedge has broken through the resistance line at 09-Mar-2021... Read more →

  • About Us
  • Privacy Policy
  • Disclaimer
  • Terms and Conditions
  • Get started for FREE
  • Contact Us
Copyright © 2022 Autochartist.com. All rights reserved.
This site uses cookies: Find out more.