Help & Documentation
  • Home
  • Sign In
  • Contact Us
  • Home
  • Sign In
  • Contact Us

KC HRW Wheat down to 469.7500

/Futures Technical Analysis - TD/KC HRW Wheat down to 469.7500

KC HRW Wheat down to 469.7500

Posted on April 6, 2020 by Autochartist wrote in Futures Technical Analysis - TD.

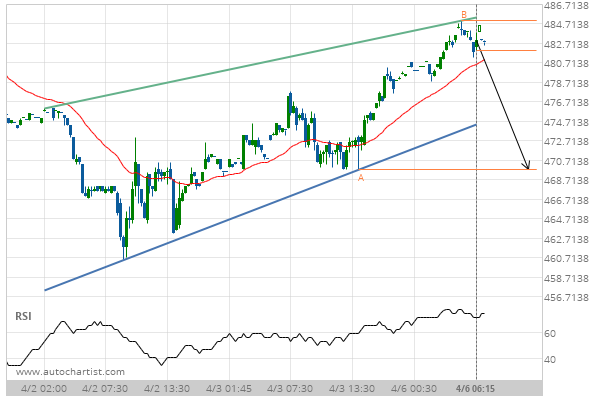
Rising Wedge identified at 06-Apr-2020 06:15 EDT. This pattern is still in the process of forming. Possible bearish price movement towards the support 469.7500 within the next 12 hours.

Tags: CBOT, KE
0 Likes
469 Views

You may also like

Soybeans up to 1445.7500
March 4, 2021
E-mini S&P 500 up to 3289.9149
August 3, 2020
KC HRW Wheat up to 465.7500
March 16, 2020

Comments are closed.

Gold Front Month up to 1689.5200 Soybeans down to 850.5000

Futures Technical Analysis – TD

Light Sweet Crude Oil Front Month up to 67.9800

March 9, 2021 11:17 am | By Autochartist

Rising Wedge identified at 09-Mar-2021 05:00 EST. This pattern is... Read more →

Feeder Cattle Front Month down to 137.2250

March 9, 2021 11:17 am | By Autochartist

Channel Down identified at 08-Mar-2021 14:00 EST. This pattern is... Read more →

Soybean Oil up to 53.2300

March 9, 2021 11:17 am | By Autochartist

Channel Up identified at 09-Mar-2021 04:30 EST. This pattern is... Read more →

Silver Front Month up to 26.5600

March 9, 2021 11:17 am | By Autochartist

Approaching Resistance level of 26.5600 identified at 09-Mar-2021 04:00 EST Read more →

10 year T-Note up to 133.1644

March 9, 2021 11:17 am | By Autochartist

Falling Wedge has broken through the resistance line at 09-Mar-2021... Read more →

  • About Us
  • Privacy Policy
  • Disclaimer
  • Terms and Conditions
  • Get started for FREE
  • Contact Us
Copyright © 2020 Autochartist.com. All rights reserved.
This site uses cookies: Find out more.