US T-Bond down to 160.4688
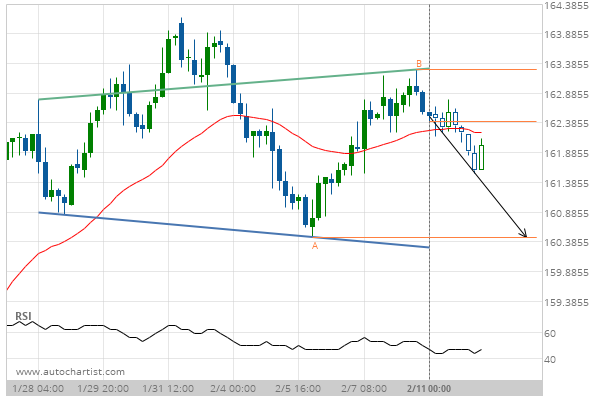
Head and Shoulders identified at 11-Feb-2020 00:00 EST. This pattern is still in the process of forming. Possible bearish price movement towards the support 160.4688 within the next 2 days.
Head and Shoulders identified at 11-Feb-2020 00:00 EST. This pattern is still in the process of forming. Possible bearish price movement towards the support 160.4688 within the next 2 days.