Help & Documentation
  • Home
  • Sign In
  • Contact Us
  • Home
  • Sign In
  • Contact Us

Lean Hogs up to 63.0500

/Futures Technical Analysis - TD/Lean Hogs up to 63.0500

Lean Hogs up to 63.0500

Posted on February 12, 2019 by Autochartist wrote in Futures Technical Analysis - TD.

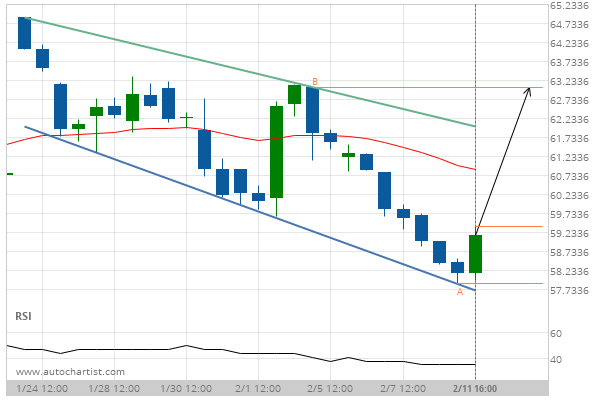
Flag identified at 11-Feb-2019 16:00 EST. This pattern is still in the process of forming. Possible bullish price movement towards the resistance 63.0500 within the next 2 days.

Tags: CME, HE
0 Likes
820 Views

You may also like

Silver Front Month up to 16.6312
July 23, 2019
Corn up to 392.0000
Corn up to 392.0000
January 1, 2020
E-mini S&P 500 up to 2946.5000
September 4, 2019

Comments are closed.

Silver March 2019 Target Level: 15.6400 KC HRW Wheat down to 487.5000

Futures Technical Analysis – TD

Light Sweet Crude Oil Front Month up to 67.9800

March 9, 2021 11:17 am | By Autochartist

Rising Wedge identified at 09-Mar-2021 05:00 EST. This pattern is... Read more →

Feeder Cattle Front Month down to 137.2250

March 9, 2021 11:17 am | By Autochartist

Channel Down identified at 08-Mar-2021 14:00 EST. This pattern is... Read more →

Soybean Oil up to 53.2300

March 9, 2021 11:17 am | By Autochartist

Channel Up identified at 09-Mar-2021 04:30 EST. This pattern is... Read more →

Silver Front Month up to 26.5600

March 9, 2021 11:17 am | By Autochartist

Approaching Resistance level of 26.5600 identified at 09-Mar-2021 04:00 EST Read more →

10 year T-Note up to 133.1644

March 9, 2021 11:17 am | By Autochartist

Falling Wedge has broken through the resistance line at 09-Mar-2021... Read more →

  • About Us
  • Privacy Policy
  • Disclaimer
  • Terms and Conditions
  • Get started for FREE
  • Contact Us
Copyright © 2022 Autochartist.com. All rights reserved.
This site uses cookies: Find out more.