Trade of the Day: USD/JPY
By: Dima Chernovolov
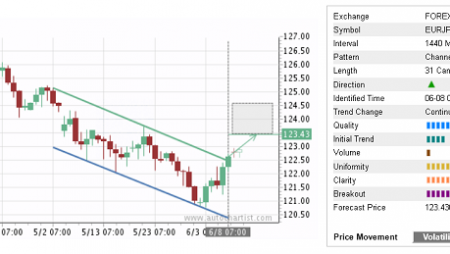
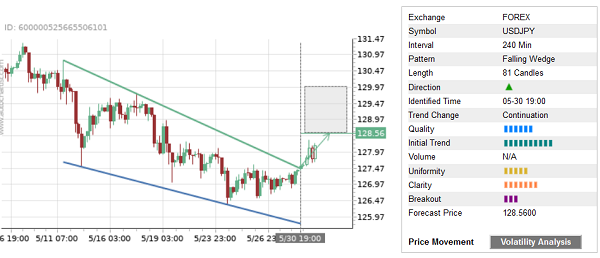
USD/JPY recently broke the 4-hour Falling Wedge chart pattern, which was recently identified by Autochartist. Autochartist rates the quality of this Falling Wedge at the 6-bar level – which is the result of the strong Initial Trend (9 bars), medium Uniformity (5 bars) and higher Clarity (7 bars). USD/JPY is expected to rise toward the forecast price 128.56.
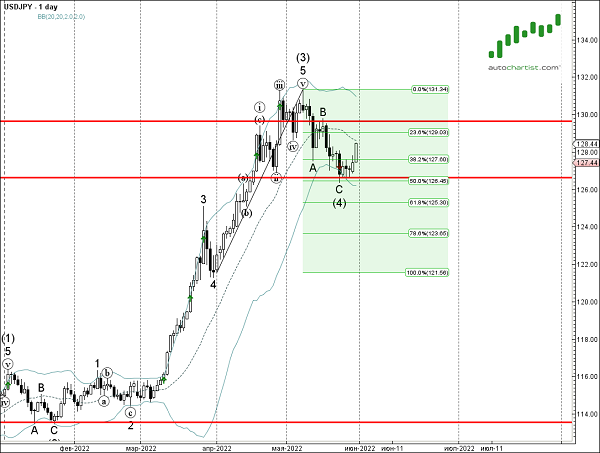
As can be seen from the daily USD/JPY chart below – the price recently reversed up from the support zone located between the support level 126.65 (which has been reversing the pair from the end of April), lower daily Bollinger Band and the 50% Fibonacci correction of the upward impulse from March. The proximity of this support area and the clear daily uptrend increase the probability USD/JPY will continue to rise toward the forecast price 128.56.