The NZDUSD has experienced a bearish breakout from the triangle pattern through its support level. The projected target is 0.5984.
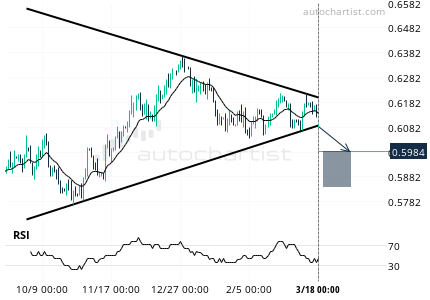
A trading opportunity was spotted on NZDUSD. The NZDUSD’s price has pierced the support line of a Triangle pattern on March 18, 2024, at midnight. A potential downward price movement is projected for the subsequent 38 days towards 0.5984.
The overall visual interpretation of this pattern is not very clear. The initial trend of the price before the establishment of this trading opportunity is extremely weak, appearing to have originated from a chaotic market. The breach through support was also notably weak. It might be advisable to wait for additional confirmation of this breakout before initiating a position.
It’s important to note that NZDUSD’s price will likely experience significant fluctuations during economic events within the forecast period. Specifically, the following events have historically caused substantial volatility in NZDUSD:
– March 19 at 03:30 (UTC): Australia RBA Interest Rate Decision
– March 20 at 18:00 (UTC): United States Fed Interest Rate Decision.