Trade of the Day: USD/JPY
By: Dima Chernovolov
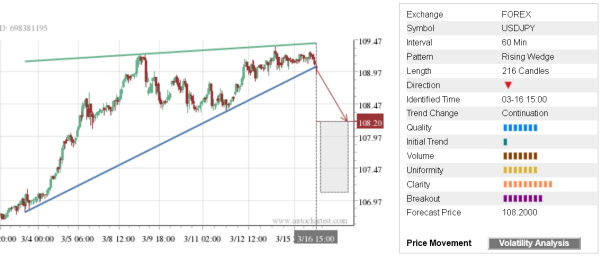
USD/JPY recently broke the hourly Rising Wedge chart pattern which was previously identified by Autochartist. Autochartist rates the quality of Rising Wedge at the 7-bar level – which is the result of the slow Initial Trend (1 bar), significant Uniformity (8 bars) and maximum Clarity (10 bars). USD/JPY is expected to fall toward the forecast price 108.20 – in line with the earlier downward reversal from the resistance area show below.
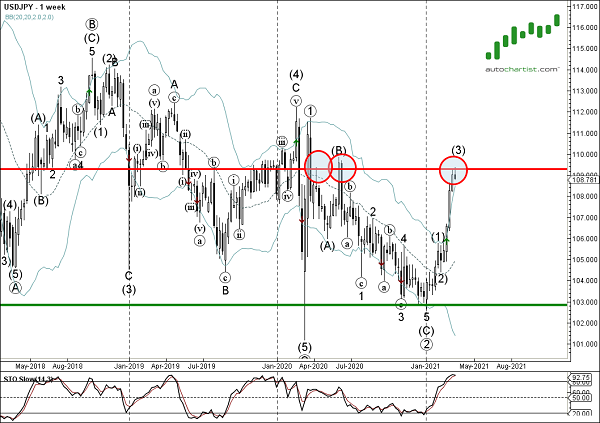
As can be seen from the weekly USD/JPY chart below – the price earlier reversed down from the resistance area located between the key resistance level 109.30 (which has been reversing the pair from the start of 2020) and the upper weekly Bollinger Band. The proximity of this resistance zone and the overbought weekly Stochastic increase the probability USD/JPY will continue to fall toward the forecast price 108.20.