Trade of the Day: AUD/CHF
By: Dima Chernovolov
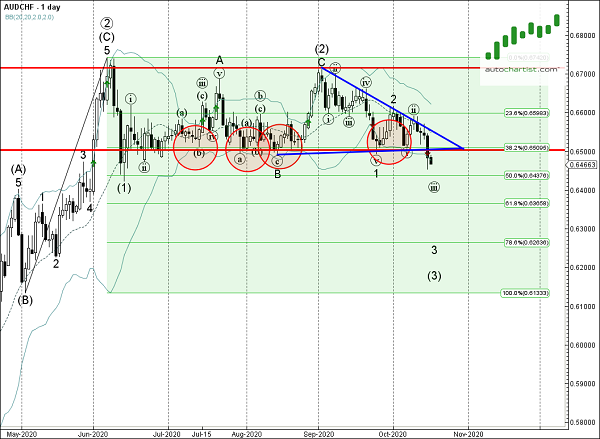
AUD/CHF recently broke the daily Triangle chart pattern, which was recently identified by Autochartist. Autochartist measures the quality of this Triangle at the 4-bar level – which is the result of the below-average Initial Trend (4 bars), medium Uniformity (5 bars) and higher Clarity (7 bars). AUD/CHF is expected to fall toward the forecast price 0.6425.
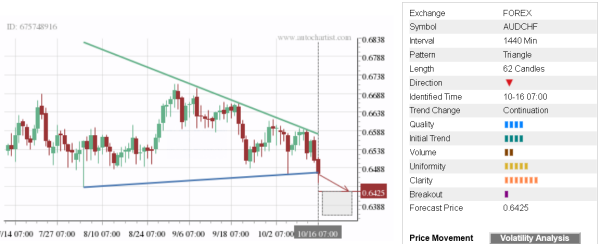
As can be seen from the daily AUD/CHF chart below, the breakout of this Triangle coincided with the breakout of the support area lying between the multi-month support level 0.6500 (which has been reversing the price from June) and the 38.2% Fibonacci correction of the upward price impulse from May. This price zone is acting as the resistance area after it was broken. The proximity of this resistance area adds to the probability AUD/CHF will continue to fall toward the forecast price 0.6425.