Trade of the Day: USD/CHF
By: Dima Chernovolov
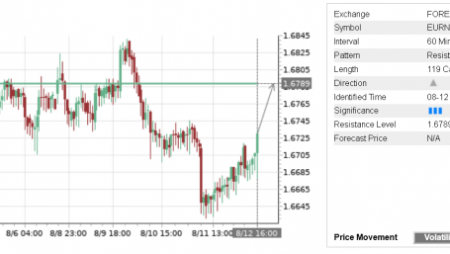
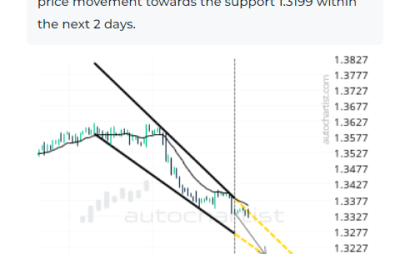
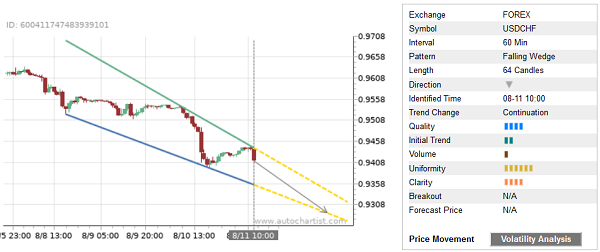
USD/CHF continues to fall inside the hourly Falling Wedge chart pattern, which was recently identified by Autochartist. Autochartist rates the quality of this Falling Wedge at the 4-bar level – which reflects the slow Initial Trend (2 bars), medium Uniformity (5 bars) and below-average Clarity (4 bars). USD/CHF is expected to fall further inside this Falling Wedge.
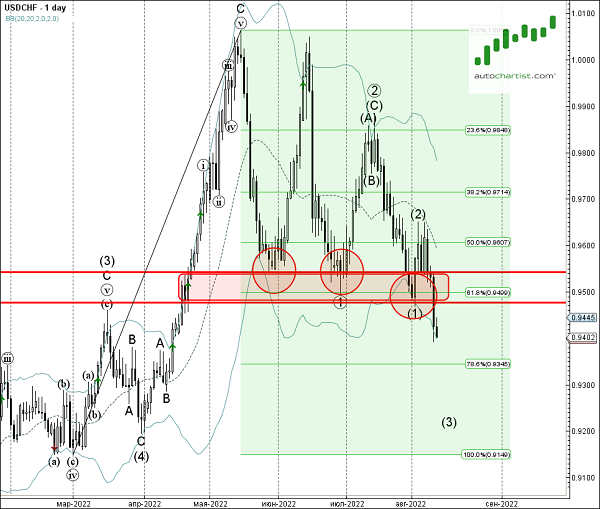
As can be seen from the daily USD/CHF chart below – the pair earlier broke through the combined support area located between the key support levels 0.9475 (monthly low from May) and 0.9542 and the 61.8% Fibonacci correction of the upward impulse March. This price area is acting as the resistance zone after it was broken. The proximity of this resistance area increases the probability USD/CHF will continue to fall inside this Falling Wedge.