Trade of the Day: USD/CAD
By: Dima Chernovolov
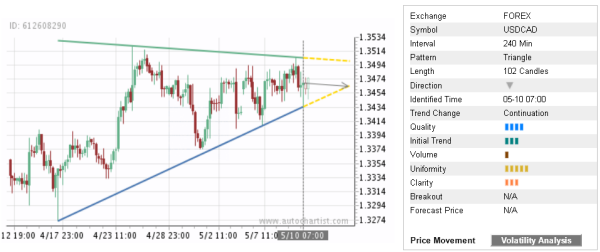
USD/CAD continues to fall insider the 4-hour Triangle chart pattern which was recently identified by Autochartist. Autochartist rates the quality of daily this Triangle at the 4-bar level – which is the result of the slow Initial Trend (3 bars), average Uniformity (5 bars) and lower Clarity (3 bars). USD/CAD is expected to fall further inside this Triangle – in line with the earlier downward reversal from the resistance area shown below.
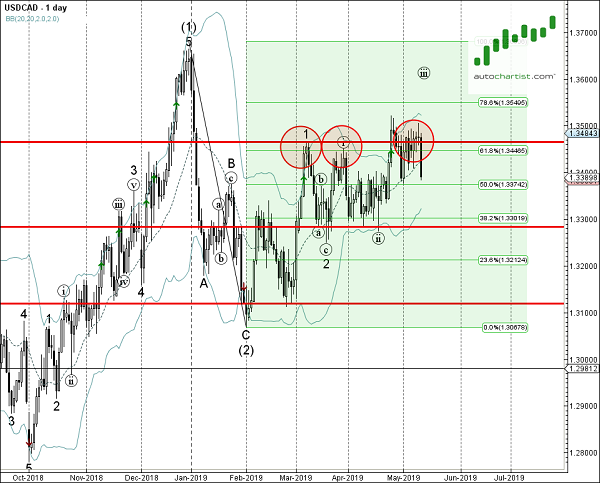
As can be seen from the daily USD/CAD below, the price earlier reversed down from the resistance area lying between the pivotal resistance level 1.3470 (which has been reversing the price from March), 61.8% Fibonacci correction of the downward impulse from January and the upper daily Bollinger Band. The proximity of this resistance area increases the probability USD/CAD will continue to fall inside this Triangle.