Trade of the Day: NZD/USD
By: Dima Chernovolov
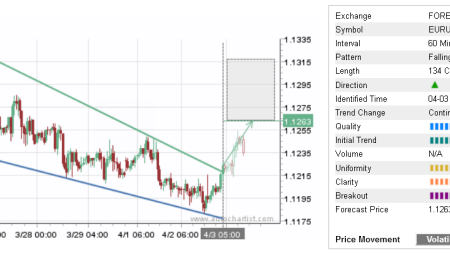
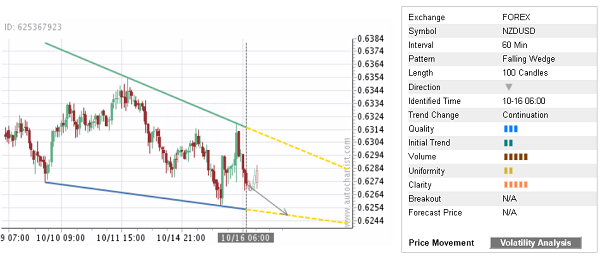
NZD/USD continues to fall inside the hourly Falling Wedge chart pattern which was identified recently by Autochartist. Autochartist rates the quality of this Falling Wedge at the 3-bar level – which reflects the slow Initial Trend (2 bars), low Uniformity (2 bars) and medium Clarity (5 bars). NZD/USD is expected to fall further inside this chart pattern – in line with the earlier downward reversal from the resistance area shown below.
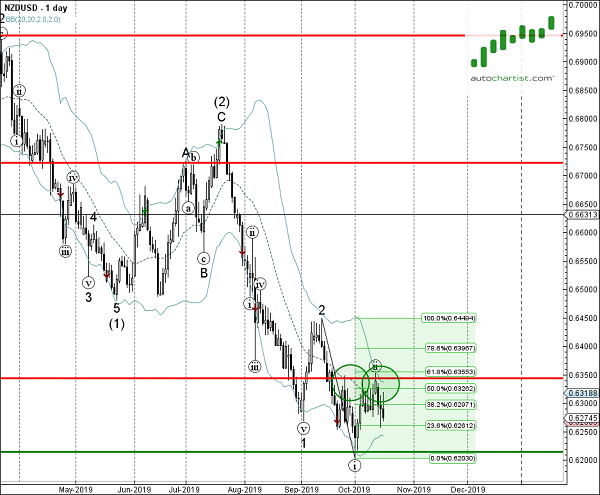
As can be seen from the daily NZD/USD chart below, the price recently reversed down from the resistance area lying between the resistance level 0.6350 (top of the previous upward correction from September), upper daily Bollinger Band and the 61.8% Fibonacci correction of the downward impulse from last month. The proximity of this resistance area increases the probability NZD/USD will continue to fall inside this chart pattern.