Trade of the Day: NZD/USD
By: Dima Chernovolov
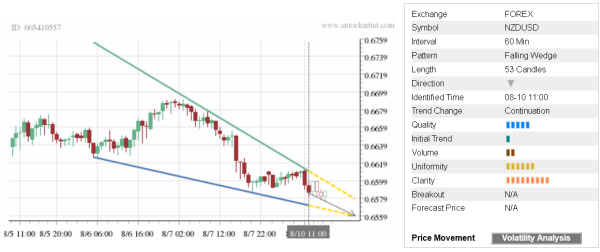
NZD/USD continues to fall inside the hourly Falling Wedge chart pattern which was recently identified by Autochartist. Autochartist rates the quality of this Falling Wedge at the 5-bar level – which is the result of the slow Initial Trend (1 bar), above-average Uniformity (6 bars) and near-maximum Clarity (8 bars). NZD/USD is expected to fall further inside this chart pattern – in line with the earlier downward reversal from the resistance zone shown below.
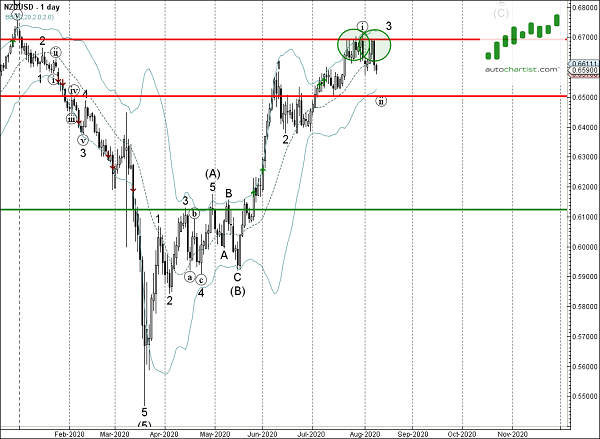
As can be seen from the daily NZD/USD chart below – the top of this Falling Wedge formed when the price reversed down with the daily Bearish Engulfing from the resistance area located between the resistance level 0.6700 (which has been reversing the price from the start of 2020) and the upper daily Bollinger Band. The proximity of this resistance area adds to the probability NZD/USD will continue to fall inside this Falling Wedge.