Trade of the Day: GBP/USD
GBP/USD continues to fall inside the daily Flag chart pattern, which was recently identified by Autochartist. Autochartist rates the quality of this Flag at the 8-bar level – which is the result of the strong Initial Trend (10 bars), above-average Uniformity (6 bars) and strong Clarity (8 bars). GBP/USD is expected to fall further inside this Flag.
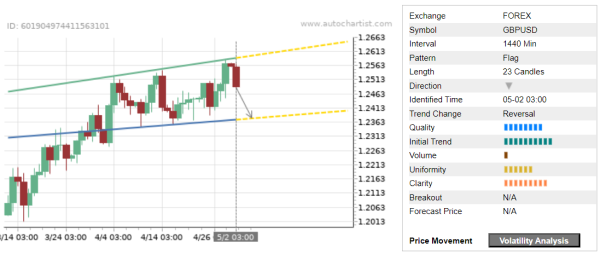
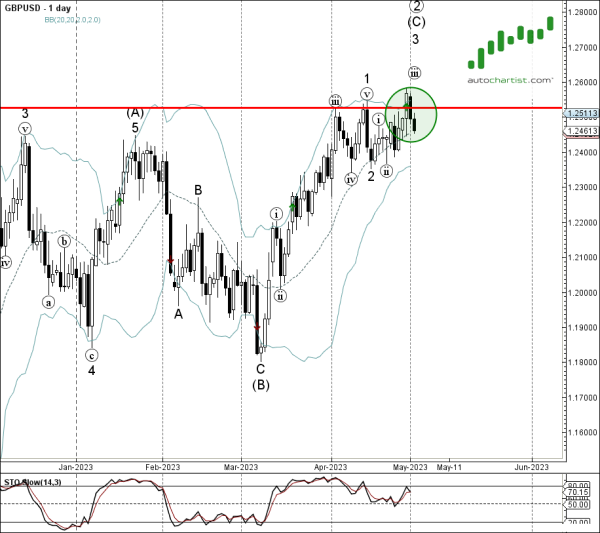
As can be seen from the daily GBP/USD chart below – the pair earlier reversed down from the strong resistance zone located between the resistance level 1.2525 (which has been reversing the price from the start of April) and the upper daily Bollinger Band. The proximity of this resistance zone and the triple bearish divergence on the daily Stochastic increase the probability GBP/USD will continue to fall inside this Flag.