Trade of the Day: NZD/JPY
By: Dima Chernovolov
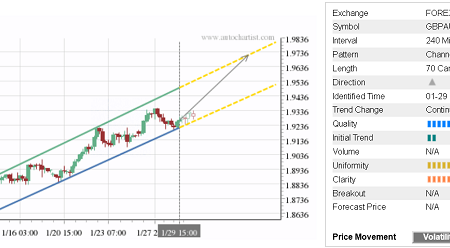
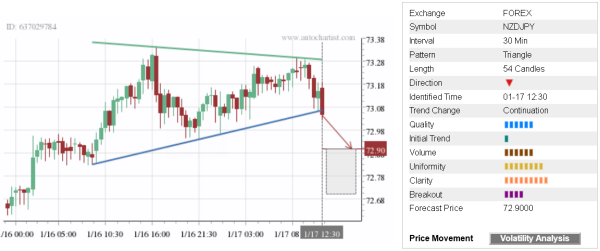
NZD/JPY recently broke the 30-minute Triangle chart pattern which was previously identified by Autochartist. Autochartist rates the quality of this Triangle at the 6-bar level – which is the result of the slow Initial Trend (1 bar), significant Uniformity (8 bars) and high Clarity (9 bars). NZD/JPY recently is expected to fall toward the forecast price 72.90 – in line with the earlier downward reversal from the resistance area shown below.
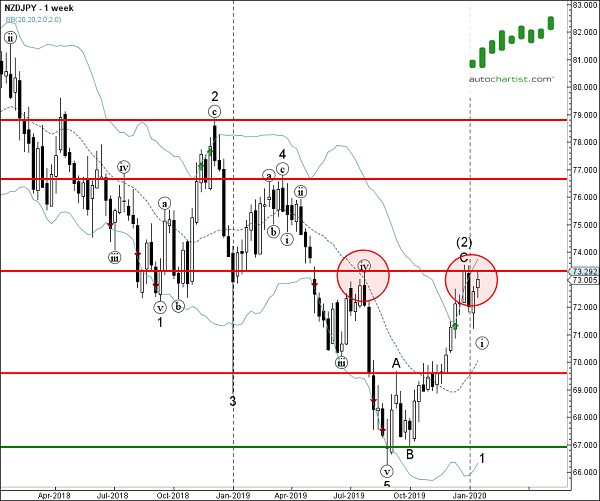
As can be seen from the weekly NZD/JPY chart below – the top of this Triangle formed when the pair reversed down from the resistance area lying between the resistance level 73.30 (which has been reversing the price from last July) and the upper weekly Bollinger Band. The proximity of this resistance area adds to the probability NZD/JPY will continue to fall toward the forecast price 72.90.