Trade of the Day: NZD/JPY
By: Dima Chernovolov
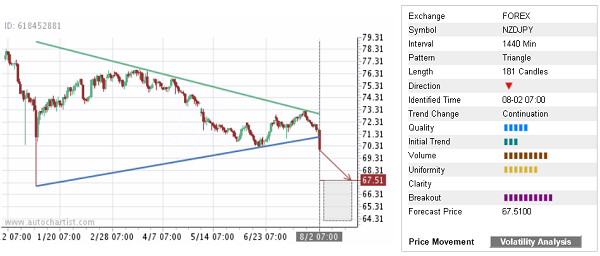
NZD/JPY recently broke the daily Triangle chart pattern which was identified earlier by Autochartist. Autochartist rates the quality of this Triangle at the 6-bar level – which is the result of the slow Initial Trend (2 bars) and significant Clarity (7 bars). NZD/JPY is expected to fall further toward the forecast price 67.51 – in line with the earlier breakout of the key support level shown below.
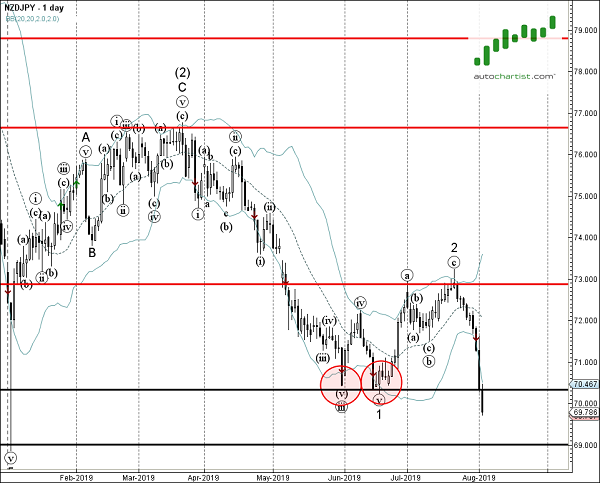
As can be seen from the daily NZD/JPY, the breakout of this Triangle coincided with the breakout of the key support level 70.325 (which has been repeatedly reversing the price from end of May). This price level is acting as resistance after it was broken. The proximity of this resistance level increases the probability NZD/JPY will continue to fall toward the forecast price 67.51.