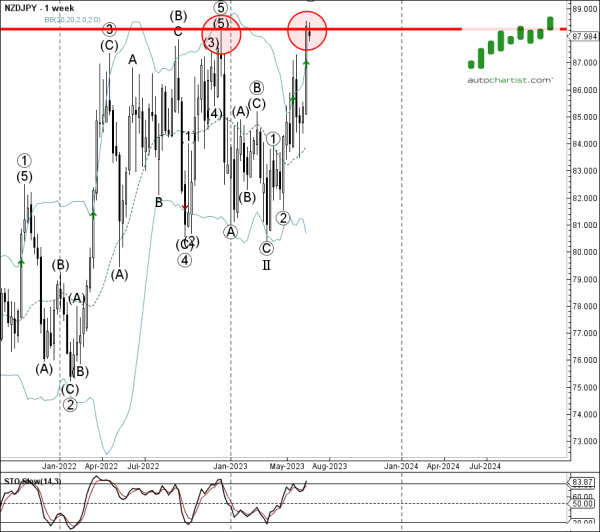
Trade of the Day: NZD/JPY
NZD/JPY recently broke the hourly Triangle chart pattern, which was recently identified by Autochartist. Autochartist rates the quality of this Triangle at the 4-bar level – which is the result of the slow Initial Trend (2 bars), low Uniformity (3 bars) and strong Clarity (8 bars). NZD/JPY is expected to fall toward the forecast price 87.69.
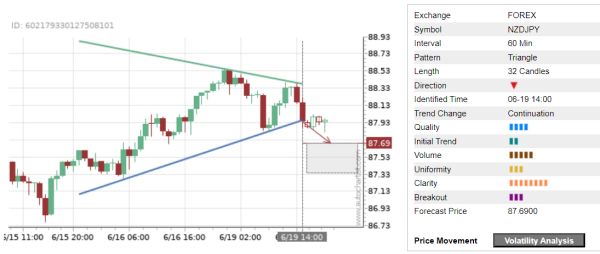
As can be seen from the weekly NZD/JPY chart below – the pair earlier reversed down from the major resistance level 88.22 (previous yearly high from 2022) standing well above the upper weekly Bollinger Band. The proximity of this resistance level and the overbought weekly Stochastic increase the probability NZD/JPY will continue to fall toward the forecast price 87.69.