Trade of the Day: NZD/JPY
By: Dima Chernovolov
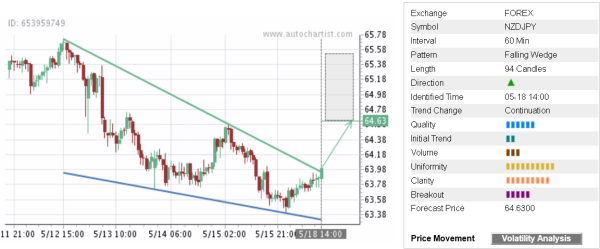
NZD/JPY recently broke the hourly Falling Wedge chart pattern which was recently identified by Autochartist. Autochartist rates the quality of this Falling Wedge at the 6-bar level – which is the result of the slow Initial Trend (2 bars), maximum Uniformity (10 bars) and significant Clarity (9 bars). NZD/JPY is expected to rise toward the forecast price 64.63 – in line with the earlier upward reversal from the support area shown below.
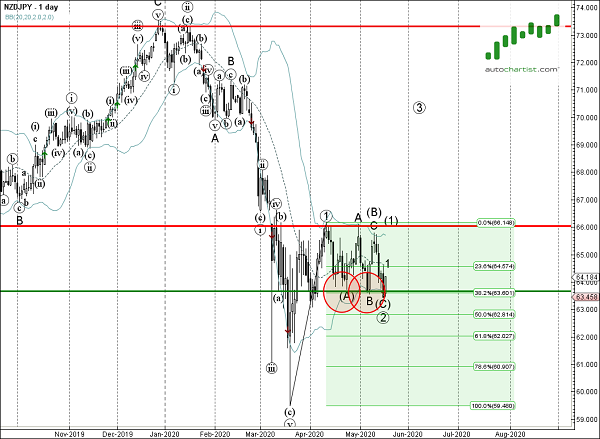
As can be seen from the daily NZD/JPY chart below – the pair earlier reversed up from the support zone lying between the key support level 63.66 (which has been reversing the price from March, lower daily Bollinger Band and the 38.2% Fibonacci retracement of the previous upward impulse from March. The proximity of this support zone increases the probability NZD/JPY will continue to rise toward the forecast price 64.63.