Trade of the Day: NZD/CAD
By: Dima Chernovolov
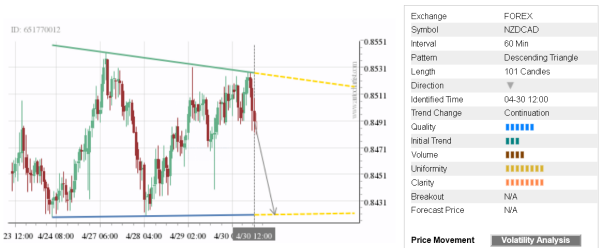
NZD/CAD continues to fall inside the hourly Descending Triangle chart pattern which was previously identified by Autochartist. Autochartist rates the quality of this Descending Triangle at the 6-bar level – which is the result of the slow Initial Trend (3 bars) and strong Uniformity and Clarity (8 bars). NZD/CAD is expected to fall further inside this Descending Triangle – in line with the earlier downward reversal from the resistance area shown below.
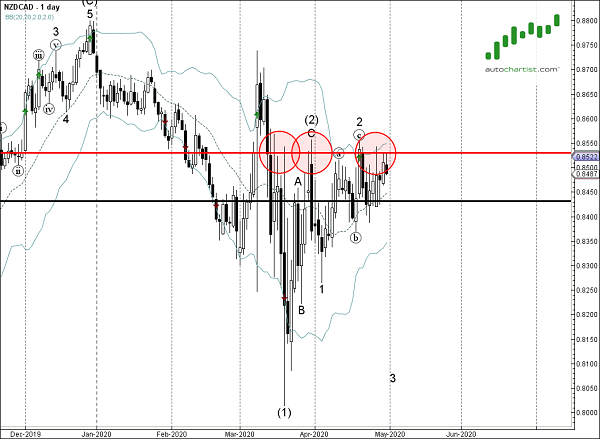
As can be seen from the daily NZD/CAD chart below – the pair recently reversed down from the from the resistance area lying between the key resistance level 0.8530 (which has been reversing the price from the middle of March) and the upper daily Bollinger Band. The proximity of this resistance area adds to the probability NZD/CAD will continue to fall inside this Descending Triangle.