Trade of the Day: GBP/NZD
By: Dima Chernovolov
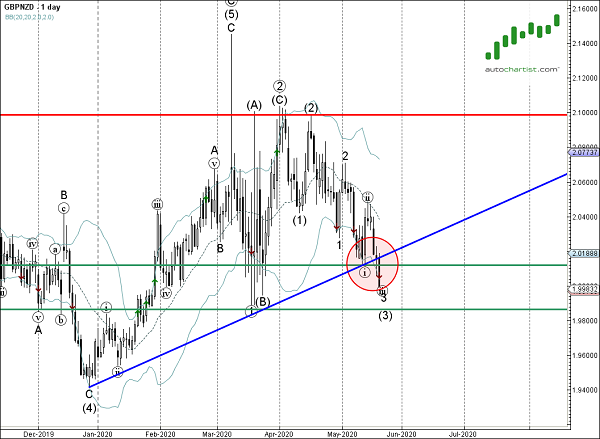
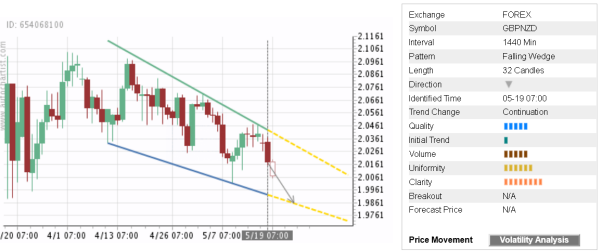
GBP/NZD continues to fall inside the daily Falling Wedge chart pattern which was previously identified by Autochartist. Autochartist rates the quality of this Falling Wedge at the 5-bar level – which is the result of the slow Initial Trend (1 bar), above-average Uniformity (6 bars) and strong Clarity (8 bars). GBP/NZD is expected to fall further inside this Falling Wedge – in line with the earlier breakout of the support area shown below.
As can be seen from the daily GBP/NZD chart below – the pair earlier broke the support area lying between the key support level 2.0115 (which stopped the price at the start of May) and the former support trendline from December. Both of these price levels are now resistance levels after they were broken. The proximity of these resistance levels increases the probability GBP/NZD will continue to fall inside this Falling Wedge.