Daily Forex Update: GBP/USD
By: Dima Chernovolov
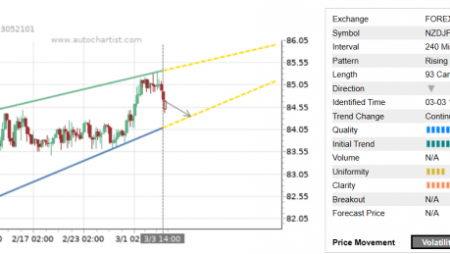
GBP/USD continues to fall after the earlier breakout of the clear Triangle chart pattern which was recently identified by Autochartist on the 4-hours charts. Autochartist rates the Quality of this Triangle at the 5 bar level – which is the result of the lower Initial Trend and Uniformity (both rated at the 2-bar level) and significant Clarity (8 bars). Autochartist measures the strength of this Triangle breakout at the maximum, 10-bar level – which adds the likelihood the pair will soon reach the forecast price 1.2443.

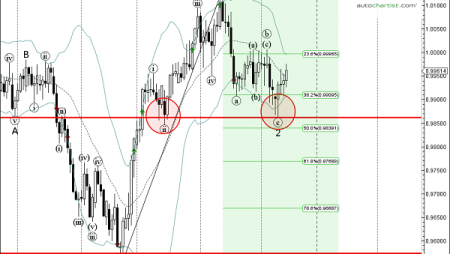
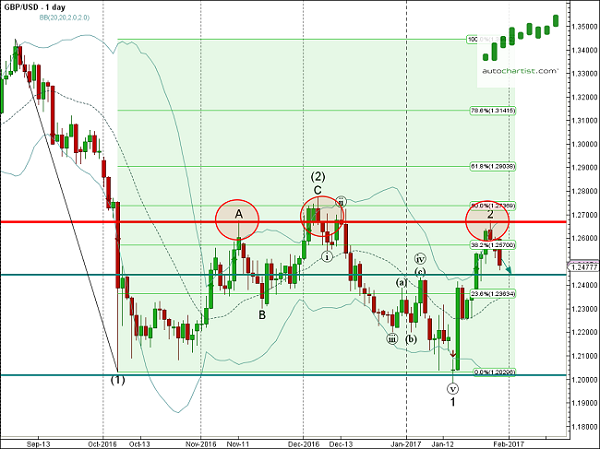
As can be seen from the daily GBP/USD chart below – the top of this Triangle formed when the pair reversed down from the strong resistance zone lying between the multi-month resistance level 1.2670, upper daily Bollinger Band and the 38.2% Fibonacci correction of the earlier downward impulse from September. The proximity of this resistance zone should add to the bearish pressure on this currency pair – increasing the probability GBP/USD will reach the forecast price 1.2443 tomorrow.

To subscribe to the e-mail alerts feature is quick and easy. Log into the Autochartist platform, click on ‘Alerts & Messaging’, enter your email address, select the market you want covered, select your language, and the time you want to get your report, and you’re done! You will now receive a quick morning technical outlook of the markets.
For further information on this and other Autochartist products visit www.autochartist.com