Trade of the Day: GBP/USD
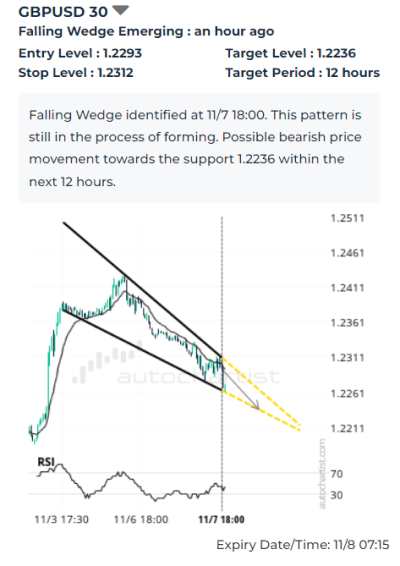
GBP/USD falling inside the 30-minute Falling Wedge chart pattern, which was recently identified by Autochartist. The chart pattern indicates possible bearish price movement toward the target level 1.2236. The following are the optimal entry and stop-loss levels calculated by Autochartist: entry at 1.2293 with the protective stop-loss at 1.2312.
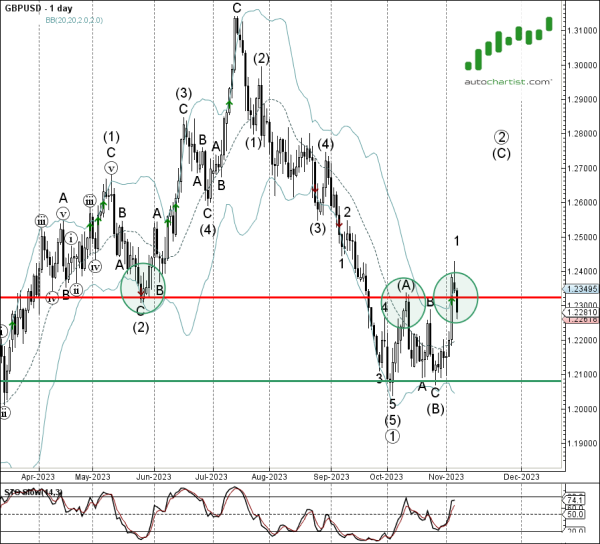
As can be seen from the daily GBP/USD chart below – the pair earlier reversed down from the key resistance level 1.2325 (former multi-month low from May), coinciding with the upper daily Bollinger Band. The proximity of resistance level 1.2325 increases the probability GBP/USD will continue to fall toward the target level 1.2236.