Trade of the Day: AUD/USD
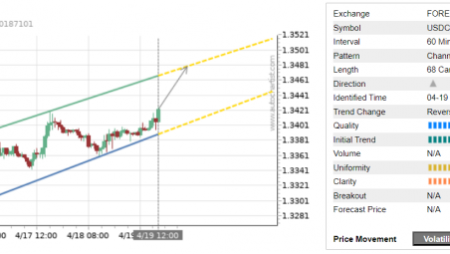
AUD/USD falling inside the 30-minute Falling Wedge chart pattern, which was recently identified by Autochartist. The chart pattern indicates possible bearish price movement toward the target level 0.6392. The following are the optimal entry and stop-loss levels calculated by Autochartist: entry at 0.6413 with the protective stop-loss at 0.6435.

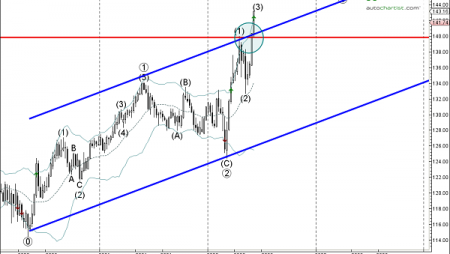
As can be seen from the weekly AUD/USD chart below – the pair earlier reversed down from the key resistance level 0.6500 (former multi-month support from May), coinciding with the 20-weekly moving average and the 38.2% Fibonacci correction of the downward impulse from the middle of this year. The strength of resistance level 0.6500 increases the probability AUD/USD will continue to fall toward the target level 0.6392.