Trade of the Day: GBP/CAD
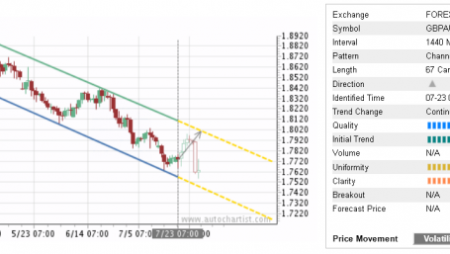
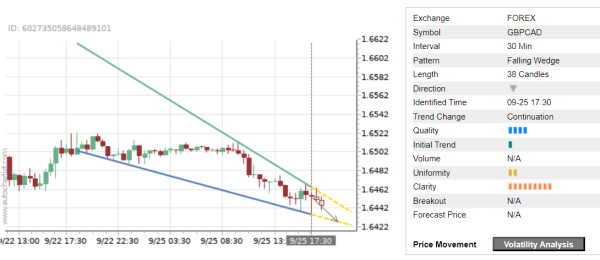
GBP/CAD continues to fall inside the 30-minute Falling Wedge chart pattern, which was recently identified by Autochartist. Autochartist rates the quality of this Falling Wedge at the 4-bar level – which is the result of the slow Initial Trend (1 bar), low Uniformity (2 bars) and strong Clarity (8 bars). GBP/CAD is expected to fall further inside this Falling Wedge.
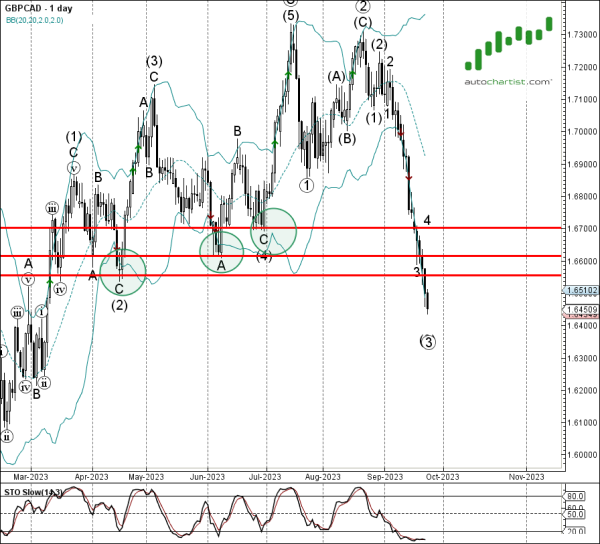
As can be seen from the daily GBP/CAD chart below – the pair earlier broke the 3 consecutive support levels 1.6700, 1.6600 and 1.6560 (each of these breakouts strengthened the bearish pressure on this currency pair). All of these levels are acting now as the strong resistance after they were broken. The proximity of these resistance levels and the strength of the active downward impulse wave increase the probability GBP/CAD will continue to fall inside this Falling Wedge.