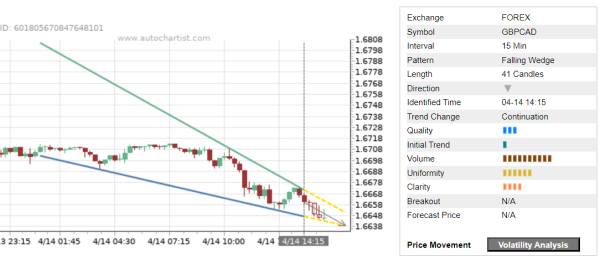
Trade of the Day: GBP/CAD
GBP/CAD falling inside the 15-minute Falling Wedge chart pattern, which was recently identified by Autochartist. Autochartist rates the quality of this Falling Wedge at the 3-bar level – which is the result of the slow Initial Trend (1 bar), significant Uniformity (7 bars) and lower Clarity (4 bars). GBP/CAD is expected to fall further inside this Falling Wedge.
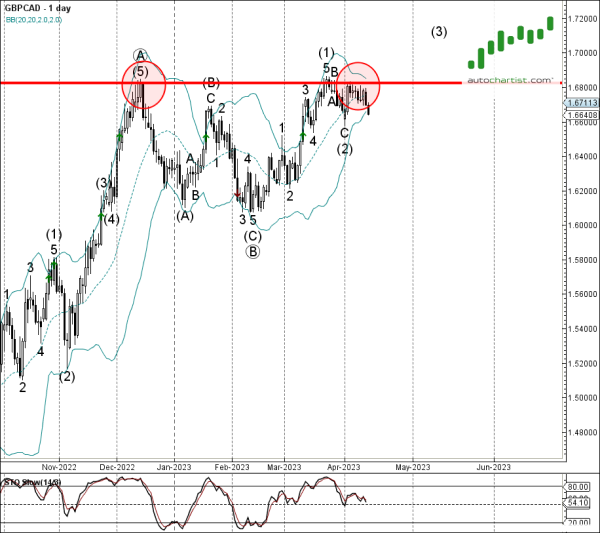
As can be seen from the daily GBP/CAD chart below – the pair earlier reversed down from the resistance zone located between the major resistance level 1.6825 (previous monthly high from December, which has been reversing the price from March) and the upper daily Bollinger Band. The proximity of this resistance zone increases the probability GBP/CAD will continue to fall inside this Falling Wedge.