Trade of the Day: EUR/USD
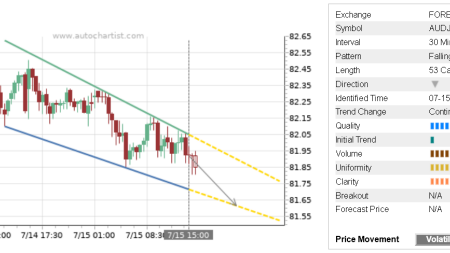
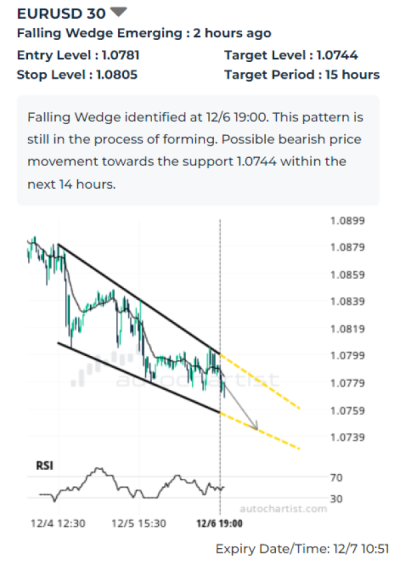
EUR/USD falling inside the 30-minute falling wedge chart pattern, which was recently identified by Autochartist. This chart pattern indicates possible bearish price movement toward the target level 1.0744. The following are the optimal entry and stop-loss levels calculated by Autochartist: entry at 1.0781 with the protective stop-loss at 1.0805.
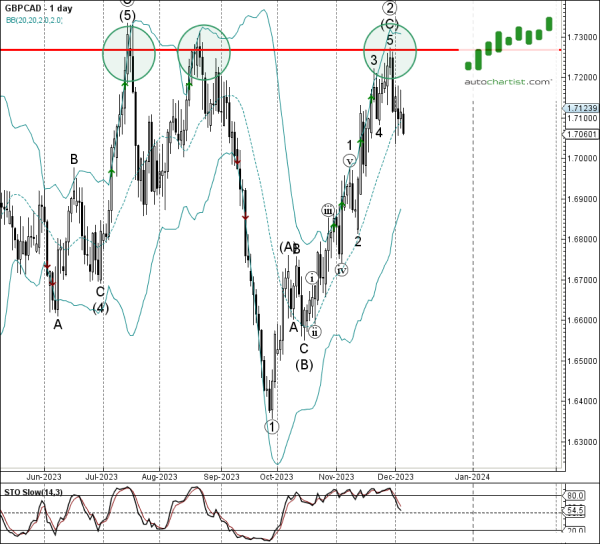
As can be seen from the daily EUR/USD chart below – the pair earlier reversed down from the powerful, long-term resistance level 1.7265 (which has been reversing the price from July) standing near the upper daily Bollinger Band. Given the proximity of the resistance level 1.7265, EUR/USD can be expected fall further toward the target level 1.0744.