Trade of the Day: EUR/AUD
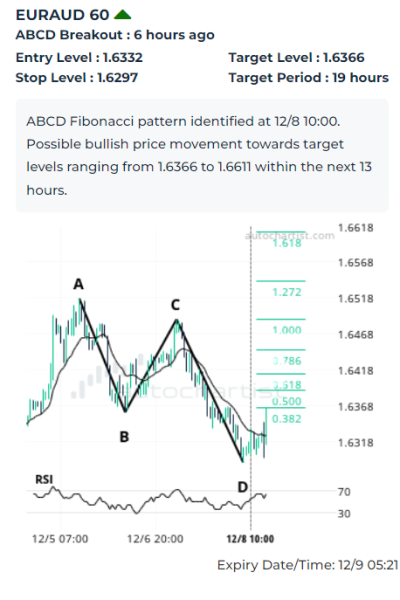
EUR/AUD recently formed the hourly ABCD Fibonacci pattern, which was identified by Autochartist. This chart pattern indicates possible bullish price movement toward the target level 1.6366. The following are the optimal entry and stop-loss levels calculated by Autochartist: entry at 1.6332 with the protective stop-loss at 1.6297.
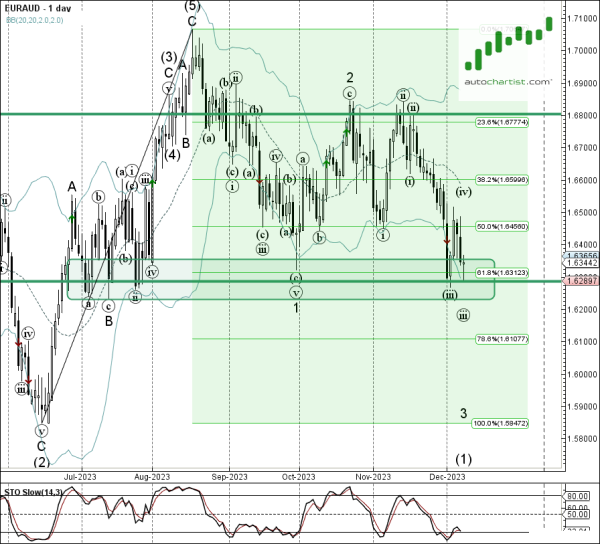
As can be seen from the daily EUR/AUD chart below – the pair earlier reversed up from the pivotal support level 1.6285 (which has been reversing the price from July) standing near the lower daily Bollinger Band and the 61.8% Fibonacci correction of the upward impulse from June. Given the strength of the support level 1.6285, EUR/AUD can be expected to rise further toward the target level 1.6366.