Trade of the Day: CAD/CHF
By: Dima Chernovolov
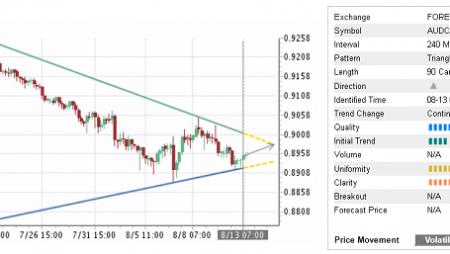
CAD/CHF continues to rise inside the 30-minute Ascending Triangle chart pattern which was recently identified by Autochartist. Autochartist measures the quality of Ascending Triangle at the 4-bar level – which is the result of the slow Initial Trend (2 bars), average Uniformity (5 bars) and higher Clarity (6 bars). CAD/CHF is expected to rise further inside this chart pattern – in line with the earlier upward reversal from the powerful support area highlighted below.

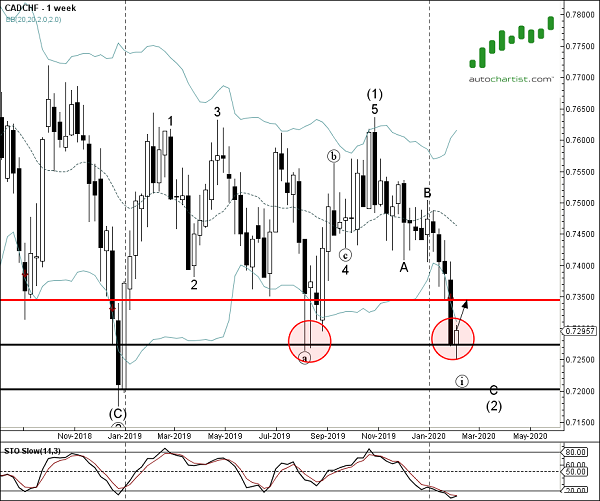
As can be seen from the weekly CAD/CHF chart below – the bottom of this Ascending Triangle formed when the price reversed up from the support area lying between the key support level 0.7270 (multi-month low from the middle of 2019) and the lower weekly Bollinger Band. The proximity of this support area and the oversold weekly Stochastic increase the probability CAD/CHF will continue to rise inside this Ascending Triangle.