Trade of the Day: AUD/NZD
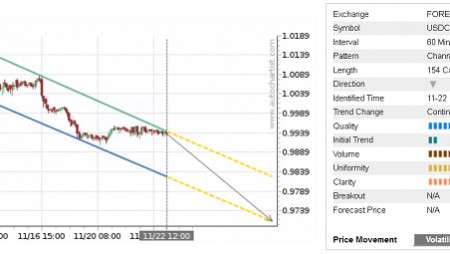
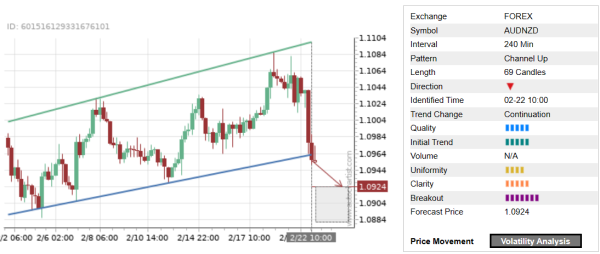
AUD/NZD recently broke the 4-hour Up Channel chart pattern, which was recently identified by Autochartist. Autochartist measures the quality of this Up Channel at the 5-bar level – which is the result of the average Initial Trend (5 bars), lower Uniformity (4 bars) and medium Clarity (5 bars). AUD/NZD is expected to fall toward the forecast price 1.0924.
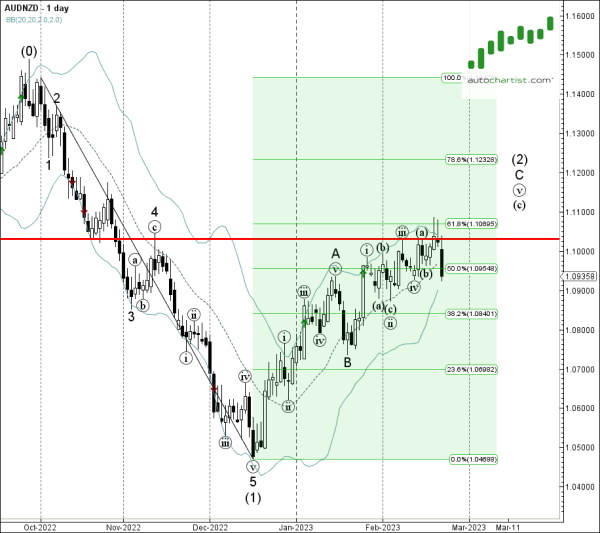
As can be seen from the daily AUD/NZD chart below – the pair earlier reversed down from the resistance area located between the key resistance level 1.1030 (former monthly high from November), upper daily Bollinger Band and the 61.8% Fibonacci correction of the earlier downward impulse from October. The proximity of this resistance area increases the probability AUD/NZD will continue to fall toward the forecast price 1.0924.