Trade of the Day: AUD/JPY
By: Dima Chernovolov
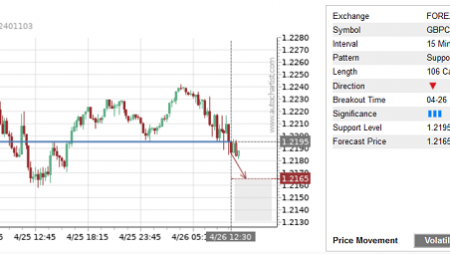
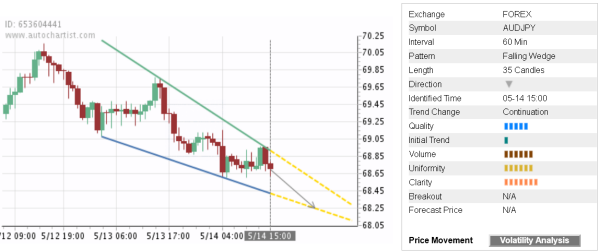
AUD/JPY continues to fall inside the hourly Falling Wedge chart pattern which was recently identified by Autochartist. Autochartist measures the quality of this Falling Wedge at the 6-bar level – which is the result of the slow Initial Trend (1 bar), above-average Uniformity (6 bars) and higher Clarity (7 bars). AUD/JPY is expected to fall further inside this chart pattern – in line with the earlier downward reversal from the resistance zone shown below.
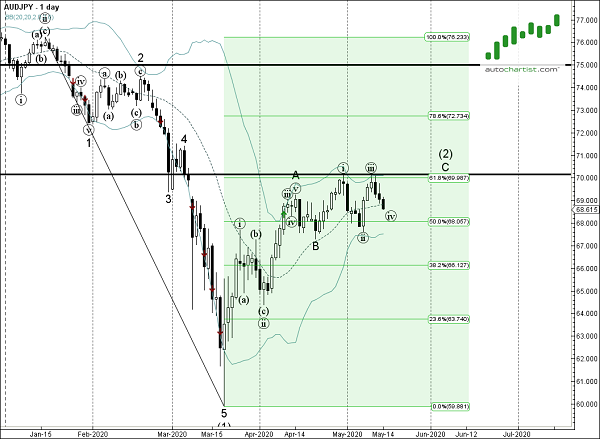
As can be seen from the daily AUD/JPY chart below – the pair earlier reversed down from the resistance zone lying between the round resistance level 70,00 (former monthly high from April), upper daily Bollinger Band and the 61,8% Fibonacci retracement of the previous downard impulse from January. The proximity of this resistance zone increases the probability AUD/JPY will continue to fall inside this Falling Wedge.