Trade of the Day: AUD/CAD
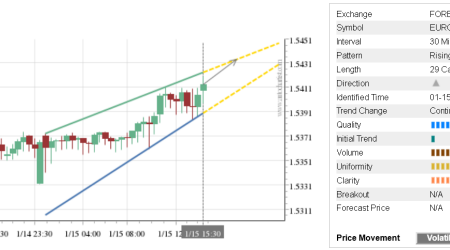
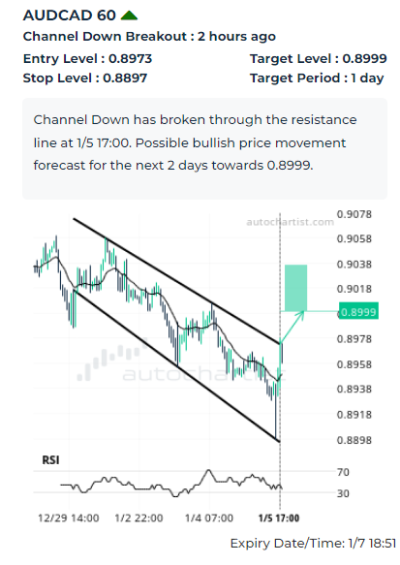
AUD/CAD recently broke the hourly down channel chart pattern, which was recently identified by Autochartist. This chart pattern indicates possible bullish price movement toward the target level 0.8999. The following are the optimal entry and stop-loss levels calculated by Autochartist: entry 0.8973 with the protective stop-loss at 0.8897.
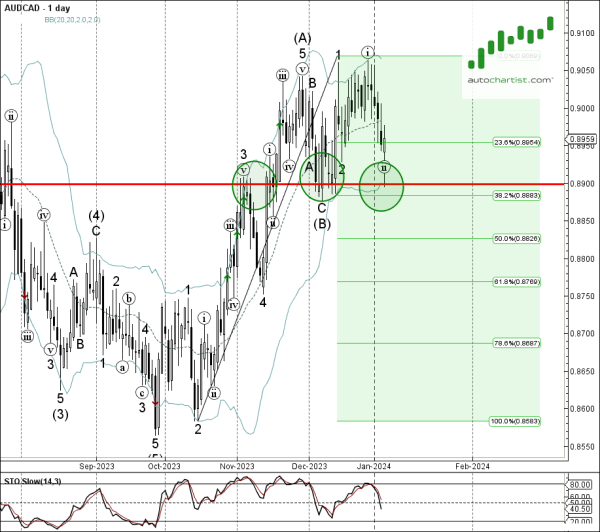
As can be seen from the daily AUD/CAD chart below – the pair earlier reversed up from the key support level 0.8900 (former resistance from November, which has been reversing the pair for the last few weeks), coinciding with the lower daily Bollinger Band and the 38.2% Fibonacci correction of the upward impulse from October. Given the proximity of the support level 0.8900, AUD/CAD can be expected rise to the target level 0.8999.