Trade of the Day: AUD/CAD
By: Dima Chernovolov
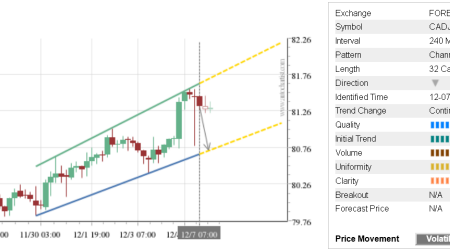
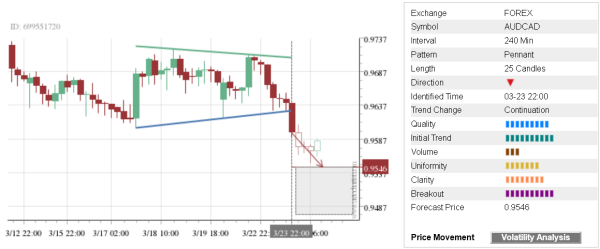
AUD/CAD recently broke the 4-hour Pennant chart pattern which was previously identified by Autochartist. Autochartist rates the quality of Pennant chart at the 9-bar level – which is the result of the sharp Initial Trend (10 bars), significant Uniformity (7 bars) and higher Clarity (8 bars). NZ AUD/CAD is expected to fall toward the forecast price 0.9546.
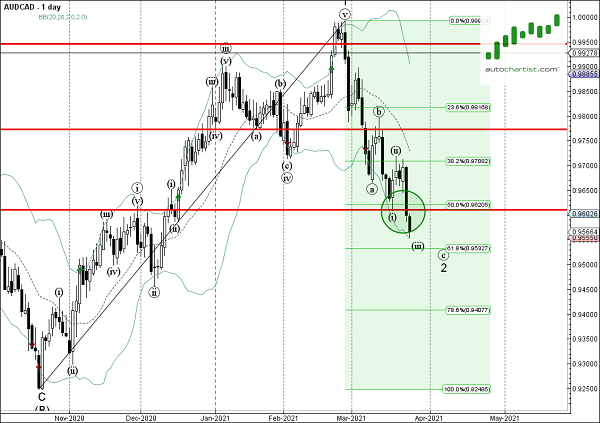
As can be seen from the daily AUD/CAD chart below – the price earlier broke the support area located between the key support level 0.9610 (which stopped the downward impulse earlier this month) and the 50% Fibonacci correction of the upward price impulse from last October. This price area is acting as the resistance zone after it was broken. The proximity of this resistance zone adds to the probability AUD/CAD will continue to fall toward the forecast price 0.9546.