The NZDUSD has experienced a bullish breakout through resistance in the form of a triangle. The target is set at 0.629.
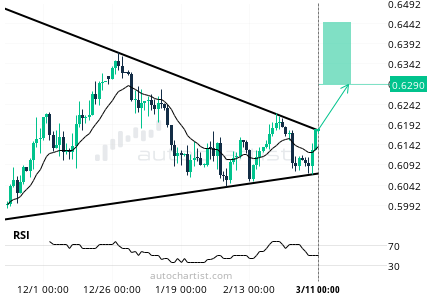
The trading setup on NZDUSD was identified, with the price breaking through the resistance line of a Triangle pattern on March 11, 2024, at midnight. A potential bullish price movement is anticipated over the next 19 days, potentially reaching 0.629.
The pattern’s overall visual quality is impressive, with a high uniformity rating indicating relatively consistent price movements throughout the pattern’s formation. The initial price trend before this trading setup was established was particularly robust. The trading setup appears quite distinct, with minimal noise during the price fluctuations between support and resistance. However, the breakout through resistance was relatively weak, suggesting that further confirmation of this breakout may be needed before initiating a position.
It’s important to note that NZDUSD’s price may experience significant volatility during any economic events that occur within the forecast period. Specifically, the following events have historically caused substantial volatility in NZDUSD:
– On March 12 at 12:30 (UTC), the United States Core Inflation Rate MoM, United States Inflation Rate YoY, United States Core Inflation Rate YoY, and United States Inflation Rate MoM will be announced.