The AUDUSD has experienced a bullish breakout from the triangle pattern, breaking through resistance. The target is set at 0.6758.
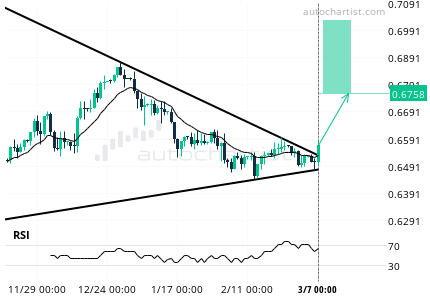
The trading configuration for AUDUSD was pinpointed, with the AUDUSD price breaking the resistance line of a Triangle pattern on March 7, 2024, at midnight. Over the following 18 days, there is a forecast for potential bullish price movement towards 0.6758.
The pattern is visually of high quality, with a high uniformity rating indicating consistent price movements throughout the pattern’s formation. The initial trend prior to this trading configuration was notably robust. The trading configuration is well-defined, with minimal noise during price fluctuations between support and resistance lines. The breakout through resistance was particularly potent, providing a strong insight into the current market sentiment.
However, it’s crucial to note that the AUDUSD price may experience significant volatility during economic events within the forecast period. Specifically, the following events have historically caused substantial fluctuations in AUDUSD’s volatility:
– March 7 at 13:15 (UTC): Euro Area ECB Interest Rate Decision, Euro Area Deposit Facility Rate
– March 8 at 13:30 (UTC): Canada Unemployment Rate, United States Unemployment Rate, United States Non Farm Payrolls
– March 12 at 12:30 (UTC): United States Core Inflation Rate MoM, United States Inflation Rate YoY, United States Core Inflation Rate YoY, United States Inflation Rate MoM.