Help & Documentation
  • Home
  • Sign In
  • Contact Us
  • Home
  • Sign In
  • Contact Us

Lean Hogs up to 70.0250

/Futures Technical Analysis - TD/Lean Hogs up to 70.0250

Lean Hogs up to 70.0250

Posted on January 22, 2020 by Autochartist wrote in Futures Technical Analysis - TD.

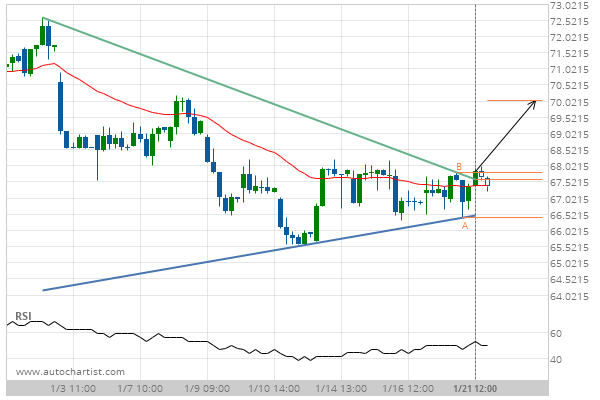
Triangle has broken through the resistance line at 21-Jan-2020 12:00 EST. Possible bullish price movement forecast for the next 21 hours towards 70.0250.

Tags: CME, HE
0 Likes
615 Views

You may also like

E-mini S&P 500 up to 2899.9250
June 13, 2019
CORN JULY 2019 down to 410.7500
June 10, 2019
Gold Front Month up to 1565.0000
August 28, 2019

Comments are closed.

Feeder Cattle Front Month down to 142.7250 Soybeans up to 933.5000

Futures Technical Analysis – TD

Light Sweet Crude Oil Front Month up to 67.9800

March 9, 2021 11:17 am | By Autochartist

Rising Wedge identified at 09-Mar-2021 05:00 EST. This pattern is... Read more →

Feeder Cattle Front Month down to 137.2250

March 9, 2021 11:17 am | By Autochartist

Channel Down identified at 08-Mar-2021 14:00 EST. This pattern is... Read more →

Soybean Oil up to 53.2300

March 9, 2021 11:17 am | By Autochartist

Channel Up identified at 09-Mar-2021 04:30 EST. This pattern is... Read more →

Silver Front Month up to 26.5600

March 9, 2021 11:17 am | By Autochartist

Approaching Resistance level of 26.5600 identified at 09-Mar-2021 04:00 EST Read more →

10 year T-Note up to 133.1644

March 9, 2021 11:17 am | By Autochartist

Falling Wedge has broken through the resistance line at 09-Mar-2021... Read more →

  • About Us
  • Privacy Policy
  • Disclaimer
  • Terms and Conditions
  • Get started for FREE
  • Contact Us
Copyright © 2022 Autochartist.com. All rights reserved.
This site uses cookies: Find out more.