Help & Documentation
  • Home
  • Sign In
  • Contact Us
  • Home
  • Sign In
  • Contact Us

US T-Bond down to 158.5781

/Futures Technical Analysis - TD/US T-Bond down to 158.5781

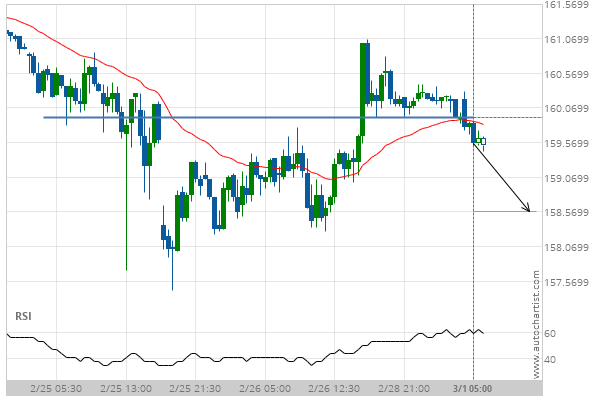
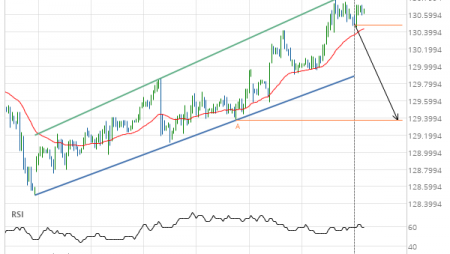
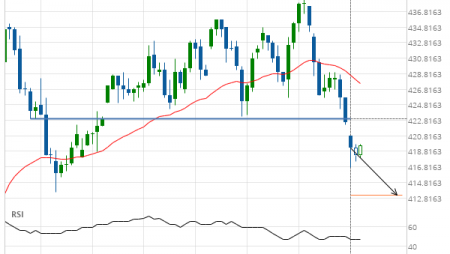
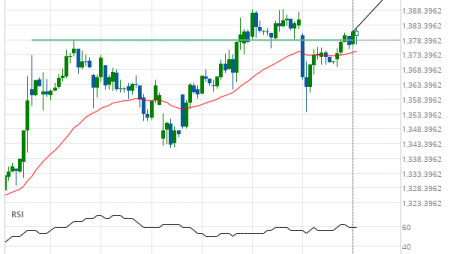
US T-Bond down to 158.5781

Posted on March 1, 2021 by admin wrote in Futures Technical Analysis - TD.

Broke through Support level of 159.9375 at 01-Mar-2021 05:00 EST

Tags: ZB
0 Likes
39 Views

You may also like

Soybeans down to 852.5000
September 6, 2019
Light Sweet Crude Oil Front Month down to 58.3985
March 15, 2019
Lean Hogs up to 72.4100
December 31, 2019

Comments are closed.

Soybean Oil excessive bearish movement Light Sweet Crude Oil Front Month up to 63.6700

Futures Technical Analysis – TD

Light Sweet Crude Oil Front Month up to 67.9800

March 9, 2021 11:17 am | By admin

Rising Wedge identified at 09-Mar-2021 05:00 EST. This pattern is... Read more →

Feeder Cattle Front Month down to 137.2250

March 9, 2021 11:17 am | By admin

Channel Down identified at 08-Mar-2021 14:00 EST. This pattern is... Read more →

Soybean Oil up to 53.2300

March 9, 2021 11:17 am | By admin

Channel Up identified at 09-Mar-2021 04:30 EST. This pattern is... Read more →

Silver Front Month up to 26.5600

March 9, 2021 11:17 am | By admin

Approaching Resistance level of 26.5600 identified at 09-Mar-2021 04:00 EST Read more →

10 year T-Note up to 133.1644

March 9, 2021 11:17 am | By admin

Falling Wedge has broken through the resistance line at 09-Mar-2021... Read more →

  • About Us
  • Privacy Policy
  • Disclaimer
  • Terms and Conditions
  • Get started for FREE
  • Contact Us
Copyright © 2020 Autochartist.com. All rights reserved.
This site uses cookies: Find out more.