Help & Documentation
  • Home
  • Sign In
  • Contact Us
  • Home
  • Sign In
  • Contact Us

KC HRW Wheat down to 409.3328

/Futures Technical Analysis - TD/KC HRW Wheat down to 409.3328

KC HRW Wheat down to 409.3328

Posted on April 25, 2019 by Autochartist wrote in Futures Technical Analysis - TD.

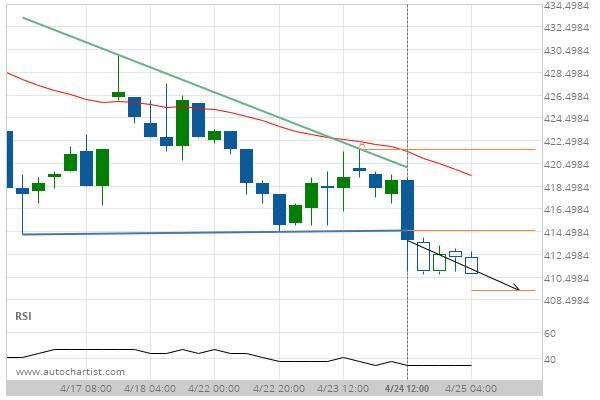
Descending Triangle has broken through the support line at 24-Apr-2019 12:00 EDT. Possible bearish price movement forecast for the next 10 hours towards 409.3328.

Tags: CBOT, KE
0 Likes
648 Views

You may also like

E-mini S&P 500 down to 3464.7500
August 28, 2020
10 year T-Note down to 129.1563
November 20, 2019
Soybean Meal up to 307.6000
March 15, 2019

Comments are closed.

Corn excessive bearish movement Feeder Cattle Front Month down to 146.6000

Futures Technical Analysis – TD

Light Sweet Crude Oil Front Month up to 67.9800

March 9, 2021 11:17 am | By Autochartist

Rising Wedge identified at 09-Mar-2021 05:00 EST. This pattern is... Read more →

Feeder Cattle Front Month down to 137.2250

March 9, 2021 11:17 am | By Autochartist

Channel Down identified at 08-Mar-2021 14:00 EST. This pattern is... Read more →

Soybean Oil up to 53.2300

March 9, 2021 11:17 am | By Autochartist

Channel Up identified at 09-Mar-2021 04:30 EST. This pattern is... Read more →

Silver Front Month up to 26.5600

March 9, 2021 11:17 am | By Autochartist

Approaching Resistance level of 26.5600 identified at 09-Mar-2021 04:00 EST Read more →

10 year T-Note up to 133.1644

March 9, 2021 11:17 am | By Autochartist

Falling Wedge has broken through the resistance line at 09-Mar-2021... Read more →

  • About Us
  • Privacy Policy
  • Disclaimer
  • Terms and Conditions
  • Get started for FREE
  • Contact Us
Copyright © 2020 Autochartist.com. All rights reserved.
This site uses cookies: Find out more.