Home Depot Inc. (HD) down to 219.00
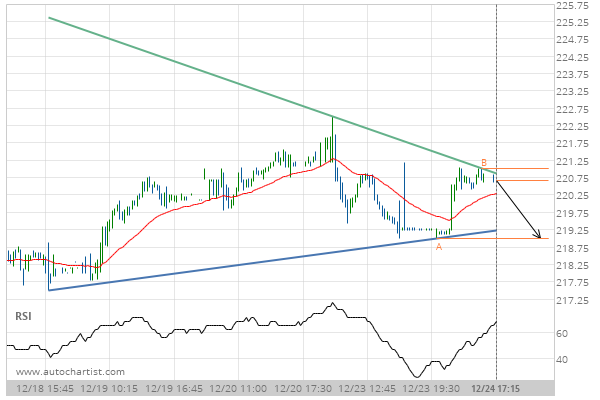
Triangle identified at 24-Dec-2019 17:15 EST. This pattern is still in the process of forming. Possible bearish price movement towards the support 219.00 within the next 15 hours.
Triangle identified at 24-Dec-2019 17:15 EST. This pattern is still in the process of forming. Possible bearish price movement towards the support 219.00 within the next 15 hours.