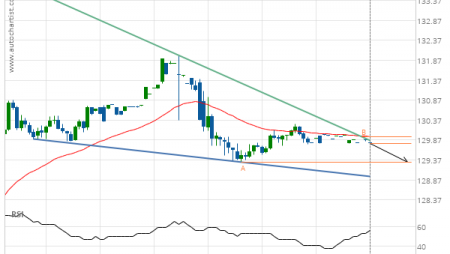
Visa (V) down to 186.16
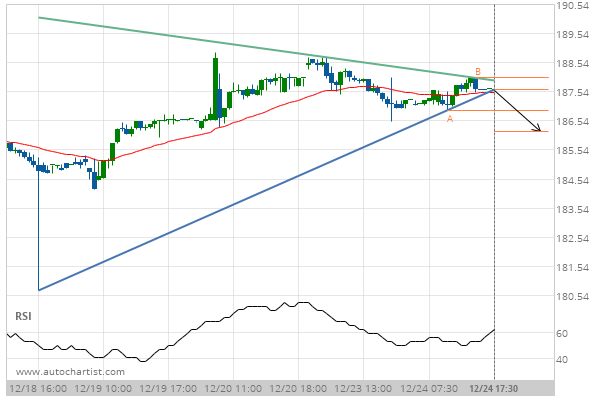
Triangle has broken through the support line at 24-Dec-2019 17:30 EST. Possible bearish price movement forecast for the next 16 hours towards 186.16.
Triangle has broken through the support line at 24-Dec-2019 17:30 EST. Possible bearish price movement forecast for the next 16 hours towards 186.16.