Help & Documentation
  • Home
  • Sign In
  • Contact Us
  • Home
  • Sign In
  • Contact Us

Goldman Sachs Group Inc. () up to 208.99

/US Stocks Technical Analysis - TD/Goldman Sachs Group Inc. () up to 208.99

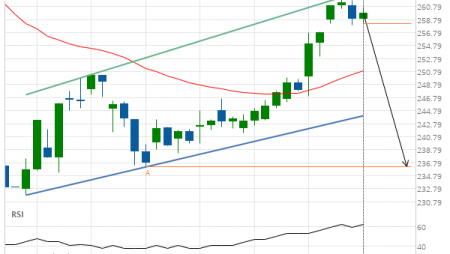
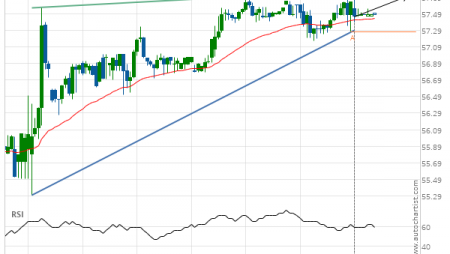
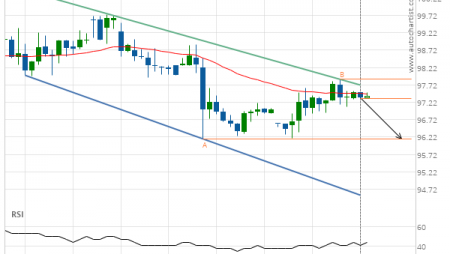
Goldman Sachs Group Inc. () up to 208.99

Posted on August 20, 2019 by Autochartist wrote in US Stocks Technical Analysis - TD.

Approaching Resistance level of 208.99 identified at 19-Aug-2019 12:30 EDT

Tags: Goldman Sachs Group Inc., GS
0 Likes
488 Views

You may also like

3m Co. (MMM) down to 161.57
January 30, 2020
Chevron (CVX) up to 119.75
February 13, 2019
WALT DISNEY (DIS) down to 128.04
October 15, 2019

Comments are closed.

Microsoft Corporation () up to 139.54 Verizon Communications Inc. (VZ) up to 57.50

US Stocks Technical Analysis – TD

Merck & Co. Inc. (MRK) up to 75.56

March 9, 2021 11:13 am | By Autochartist

Rising Wedge identified at 08-Mar-2021 19:30 EST. This pattern is... Read more →

Jpmorgan Chase & Co. (JPM) down to 147.97

March 9, 2021 11:13 am | By Autochartist

Channel Up identified at 08-Mar-2021 19:00 EST. This pattern is... Read more →

Visa (V) down to 215.41

March 9, 2021 11:13 am | By Autochartist

Triangle identified at 08-Mar-2021 20:00 EST. This pattern is still... Read more →

Home Depot Inc. (HD) down to 247.10

March 9, 2021 11:13 am | By Autochartist

Channel Down identified at 08-Mar-2021 16:00 EST. This pattern is... Read more →

Intel Corporation () down to 58.10

March 9, 2021 11:13 am | By Autochartist

Approaching Support level of 58.10 identified at 08-Mar-2021 16:00 EST Read more →

  • About Us
  • Privacy Policy
  • Disclaimer
  • Terms and Conditions
  • Get started for FREE
  • Contact Us
Copyright © 2020 Autochartist.com. All rights reserved.
This site uses cookies: Find out more.