Verizon Communications Inc. (VZ) up to 57.70
![](https://trader.autochartist.com/wp-content/uploads/2020/07/TDUSStocksTA5f22abc29a648d4198e33e74.png)
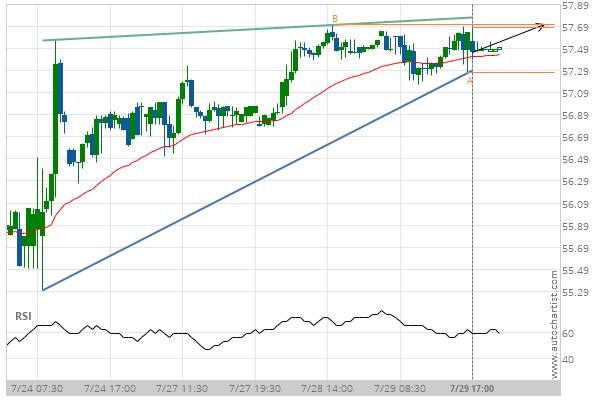
Ascending Triangle identified at 29-Jul-2020 17:00 EDT. This pattern is still in the process of forming. Possible bullish price movement towards the resistance 57.70 within the next 13 hours.