Help & Documentation
  • Home
  • Sign In
  • Contact Us
  • Home
  • Sign In
  • Contact Us

Gold Front Month up to 1276.0702

/Futures Technical Analysis - TD/Gold Front Month up to 1276.0702

Gold Front Month up to 1276.0702

Posted on April 24, 2019 by Autochartist wrote in Futures Technical Analysis - TD.

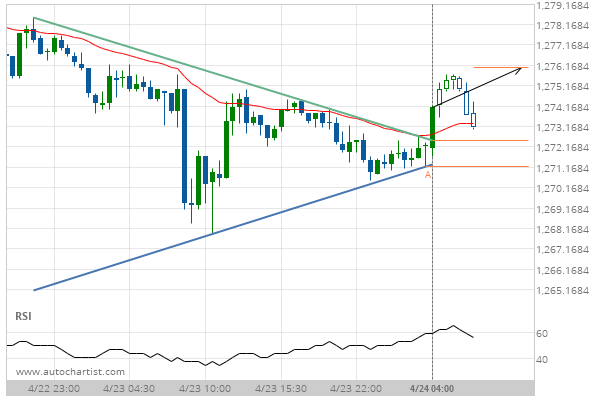
Triangle has broken through the resistance line at 24-Apr-2019 04:00 EDT. Possible bullish price movement forecast for the next 7 hours towards 1276.0702.

Tags: COMEX, GC
0 Likes
809 Views

You may also like

Soybean Meal up to 395.0500
October 27, 2020
Soybean Meal down to 310.1000
January 25, 2019
10 year T-Note down to 137.5000
April 8, 2020

Comments are closed.

Silver Front Month down to 14.7400 US T-Bond up to 147.1049

Futures Technical Analysis – TD

Light Sweet Crude Oil Front Month up to 67.9800

March 9, 2021 11:17 am | By Autochartist

Rising Wedge identified at 09-Mar-2021 05:00 EST. This pattern is... Read more →

Feeder Cattle Front Month down to 137.2250

March 9, 2021 11:17 am | By Autochartist

Channel Down identified at 08-Mar-2021 14:00 EST. This pattern is... Read more →

Soybean Oil up to 53.2300

March 9, 2021 11:17 am | By Autochartist

Channel Up identified at 09-Mar-2021 04:30 EST. This pattern is... Read more →

Silver Front Month up to 26.5600

March 9, 2021 11:17 am | By Autochartist

Approaching Resistance level of 26.5600 identified at 09-Mar-2021 04:00 EST Read more →

10 year T-Note up to 133.1644

March 9, 2021 11:17 am | By Autochartist

Falling Wedge has broken through the resistance line at 09-Mar-2021... Read more →

  • About Us
  • Privacy Policy
  • Disclaimer
  • Terms and Conditions
  • Get started for FREE
  • Contact Us
Copyright © 2022 Autochartist.com. All rights reserved.
This site uses cookies: Find out more.